276. ECONOMIC GROWTH WITH FLAT FOSSIL FUEL CONSUMPTION
One of the central beliefs of peak oil is that flat or declining consumption of fossil fuels will cause economic growth to halt and decline.
Oddly enough, DOE statistics show that -- at least in the case of personal gasoline and natural gas consumption -- this was not true in the U.S. for the 20 year period from 1981 to 2001.
Per capita oil consumption for transportation was flat:
 Per capita residential consumption of natural gas declined:
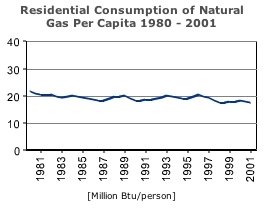 Meanwhile, the real GDP doubled (click for a clearer picture):
And the DOW rose from 947 in Jan. 1981 to 10788 in Dec. 2000 -- an increase of about 11.4 times (1040%). With no increase in per capita consumption of oil for transportation, or residential natural gas.
-----
Thanks to Paul and dub_scratch, who caught me doing some of my usual monkey business in this post. They are right that a better comparison is with real GDP per capita, given in the following Table:

As you can see, the point holds true. Real GDP per capita grew by 50% from 1981 to 2001.
More broadly, this shows that increasing real GDP (both gross and per capita) and increasing stock prices are perfectly compatible with zero growth in personal driving, and decreasing use of natural gas in the home.
-- by JD
posted by JD @ 6:54 PM
10 comments
![]()
![]()

10 Comments:
Oooh, feel the over-reaching. There is a point here, but it is obscured by comparing per capita energy-use statistics with gross GDP numbers, and the cherry on top quotation of the gross Dow number.
I am going to ignore the Dow. The GDP is suspect of course as well, since it includes *all* economic activity and only the transportation and home heating trends are cited on the energy use side, but c'est la vie.
Per capita GDP 1980 = $24,500
Per capita GDP 2001 = $37,373
So a 50% increase, nothing to sneeze at, but not a doubling.
I neglected to point out in the preceding that the per capita GDP numbers are from here:
http://www.demographia.com/db-ppp60+.htm
Another way to put this is to say that the economy's energy intensity is decreasing. I've heard this statistic cited to explain why the US economy continues to grow even though oil is expensive.
I wonder if it is possible to create conservation measures that specifically target energy intensity. Those would seem particularly desireable because they would promote economic growth.
This is a good point. I've read that our expenditures on energy are only about 5% of GDP. Compare to something like health care at about 15%. Energy as percent of GDP has been declining since the 1970s.
It's a touchy subject, even economists do not agree on either or not a decreasing (oil consumed)/(real GDP) is an indicator that our econmomy is "dematerializing" (see work of Robert Ayres). I personally believe that the oil consumed per capita, which has been increasing since the 80s, is a better indicator of our oil dependence .
For energy intensity since from 1973 - 2005 see -
http://www.eia.doe.gov/emeu/mer/pdf/pages/sec1_16.pdf
also note that overall US energy usage has barely increased since 2000
see -
http://www.eia.doe.gov/emeu/mer/pdf/pages/sec1_3.pdf
Let's say that there were less Americans in 1980 than there are in 2006.
To put it in a very simple picture: if, in 1980, we had a total population of let's say, a hundred people in the nation that used 20 barrels of oil per person a year. That means 100 times 20 = 2000 barrels in 1980.
Now, let's assume that in 2006, there's now two hundred people living in the U.S. The chart suggests that these people's personal need for oil hasn't changed. So their per capita use is still at the level of 20 barrels per person a day, right? Then that would mean that 200 times 20 = 4000 barrels of oil. That's double the amount of what the folks in 1980 used.
So the per capita need for oil might not have changed, but when the population grows, the overall amount of oil needed will still grow. 200 million people use more oil than 100 million people.
That's an increase in energy consumed since the overall need for oil has increased. And as far i understand economics, an increase in a population increases consumption of products that have to be made first, and for that, one needs more energy.
I think that the flat line for per capita fuel consumption shouldn't be in your post, 'cause it doesn't make sense.
This post misses the point - in a post-peak world it wouldn't be flat production per se causing recession, but higher prices - that it demand outstripping supply.
i.e. oil shocks of the 1970s and 80s caused stagflation and recession - because they pushed price up so much.
Also - the change from manufacturing economy to a service based econmy would have curbed oil and natural gas demand - i.e. it doesn't take as much energy to employ a sales-person at walmart say compared to someone operating heavy machinary.
Why does his chart only show petroleum use for transportation and residential natural gas use? Aren't petroleum and natural gas used for much more than those things? Especially when we're talking about economic growth, it seems disingenuous to completely ignore commercial use of fossil fuels.
Post a Comment
<< Home