237. GLITCH IN CAMPBELL'S DISCOVERY FIGURES
Let's return once again to ASPO's "Growing Gap":
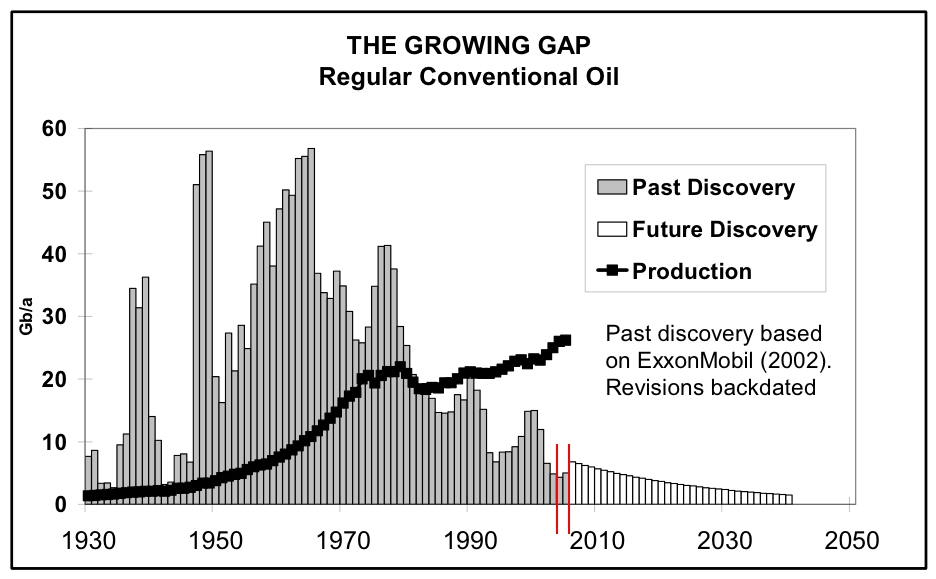
I have enlarged and transcribed this graph into numbers by measuring with a ruler. Note the two years between the red bars (click to enlarge). These correspond to the years 2004 and 2005, and Campbell's figures for discovery in those years are (respectively) 4.1Gb and 4.9Gb.
Now we need an independent check on these numbers, so let's turn to another unsung hero of peak oil: pup55 from peakoil.com. pup55 isn't playing to the cameras, making statements about going back to the stone age etc. He's doing the PO community a much greater service: quietly compiling data.
pup55 follows and compiles the monthly discovery announcements from Alexander's Oil and Gas Connections, as he describes in this thread. As pup55 would be the first to admit, his methodology isn't airtight. It overestimates in some ways, and underestimates in others. The beauty of it, though, is that the data and methodology are open, so anyone can go verify it for themselves. Whatever its defects, this is far superior to the presentation of Colin Campbell -- the man behind the curtain -- who gives no genuine sources for his data, and does not describe his methodology.
The bottom line for our purposes is this: pup55 has counted 9.7Gb in discovery for 2004 and 12.6Gb in discovery for 2005. pup55 has posted the spreadsheets if you want to check them yourself.
Sooo.... What's going on here? Why are Campbell's numbers so low? Where is he getting them from? Why is it the industry has -- verifiably -- announced roughly 12.6Gb in discoveries for 2005, while Campbell claims we have only discovered 4.9Gb?
------
Chris Vernon posted a pertinent comment, which I will address here because it's important. He writes:
Could the fact that these numbers are larger than Campbell's be because Campbell is counting new discovery made today in a field originally discovered in say 1980 as a 1980 discovery and not a 2006 discovery. Booking reserves for the year the field was originally discovered?This is a reasonable theory, so to test it, I enlarged and screen captured the "Growing Gap" graph from 2005-01, and the "Growing Gap" graph from 2006-02. I then adjusted them to the same size, printed them out, overlayed them and held them up to the light. It turns out that the values for all years from 1930 to 2002 are identical. In the 2005 version, the value for 2003 is 2.8Gb, and all subsequent values are "Future Discovery" (i.e. projections, not historical values). In the 2006 version, the values are 2003=4.9Gb, 2004=4.1Gb and 2005=4.9Gb, and all subsequent values are "Future Discovery".
Now, pup55 has counted 9.7Gb for 2004, and 12.6Gb for 2005, and that gives a total of 13.3Gb more than Colin Campbell for those two years. So where did that 13.3Gb go? It couldn't have gotten backdated to any year between 1930 and 2002 because values for those years have not changed. The only place it could have gone is 2003, but Campell's value for 2003 only increased by 2.1Gb from 2005 to 2006. So the inevitable conclusion seems to be that:
a) Chris's theory is incorrect. Colin Campbell isn't doing any backdating. The past curve stays exactly the same from year to year, AND
b) 11Gb of discovery from 2004 and 2005 -- roughly an entire Prudhoe Bay -- just disappeared. Where did it go?
-----
Also, one more thing. Campbell "cites" ExxonMobil(2002) as his source for past discovery figures. I showed below (in #230) that this is a vaporware citation. As much of a problem as that is, there's yet another problem -- i.e. how is it that Campbell gets figures for 2003, 2004 and 2005 from a source published in 2002? This is very fishy, and would probably merit an F even as a college term paper due to shoddy documentation and evidence.
-- by JD
posted by JD @ 2:18 AM
4 comments
![]()
![]()

4 Comments:
I think that Chris is right. it makes a big difference when discoveries are backdated (see this figure from the ASPO).
khebab, do you have the link for that figure in context? Is it a part of some article which gives more information on it?
JD,
The original link is the following:
International Energy Agency accepts Peak Oil
I don't understand completely the exact reason for the backdating. For me, if a field is not under production it is as if it was not discovered. I have the feeling that it is also an effort to "normalise" the data and make the discovery pattern appear as old as possible. A discovery is an historical fact whereas the production starting year is related to economic factors.
I have the feeling that it is also an effort to "normalise" the data and make the discovery pattern appear as old as possible.
I've often had the same thought.
Post a Comment
<< Home