322. HUBBERT'S CLIFF
According to the familiar Hubbert Theory, world oil production will gradually increase, then peak and gradually decline, tracing out a smooth symmetrical trajectory known as Hubbert's Curve:
 Hubbert's Curve
At one time, Hubbert's theory was the standard view among peak oilers. Today, however, it is being increasingly superceded by a new concept which I call the Hubbert Cliff theory. According to this theory, world oil production will not follow the Hubbert Curve. It will peak, and then fall off a cliff:
 Hubbert's Cliff
Cliffers talk a lot about horizontal drilling, "watering out", "bottlebrush" drilling, and "supersucker" wells. These modern extraction technologies have, they say, already sucked up the right side of the Hubbert Curve, making a gradual decline impossible. The signs are showing up everywhere. Here's a standard rehash of the argument:
The slow decline of oil production in the United States (specifically the continental US) is aberrant and not be generalized. Rather look to Mexico and it's supergiant field Cantarell for guidance (declines of 12%), the North Slope and North Sea (8-12%) Yibel, and a host of other regions depleted with great expertise, at great expense, using the most modern technologies available. This is our future.The argument is pretty primitive, and generally isn't any more sophisticated than that. Cliffers cherry pick the worst years, in the worst countries, wave their magic wand and say "That's how the world will perform".
The cliffer argument ignores an important fact: Small or even fairly large areas collapsing at high rates have very little effect on the world. If Yibal (at 250kbd) collapses in one year, for a decline rate of 100%, the world only drops by 0.3%. Even if Ghawar collapses at 12% a year, that will only shave 0.7% per year off the world total.
Let's look at some individual countries to see how this works.
EIA C&C stats for Mexico after its peak in 2004 look like this:
2004: 3383kbd
2005: 3334
2006: 3256
2007: 3126 (9-month average)
That's an annual decline rate of 2.8%, not 12%. Even Mexico (during the collapse of Cantarell!) doesn't collapse like Cantarell.
For the North Slope, stats(pdf) from the Alaska Tax Division show that liquids production dropped from a peak of 2.006mbd in 1988 to 0.74mbd in 2007. That's an annual decline rate of 5.2%. But, as we know, that was absorbed into U.S. liquids production, which has been declining at a mild rate of 1.4% per annum since 1970.
Yibal was one oil field, and it didn't cause oil production in Oman to collapse. Indeed, Yibal went off the cliff in 1997 (Source) and Oman continued to increase production for 3 more years:
1997: 904kbd
1998: 900
1999: 910
2000: 970
970kbd in 2000 was Oman's EIA C&C peak, and today it pumps 707kbd. That's an annual decline rate of 4.4%. Well short of 8-12%.
UK C&C peaked in 1999 at 2684kbd and today is at 1486kbd, for an annual decline rate of 7.2%, still below 8-12%.
Furthermore, all of these rapidly collapsing fields/regions were uneventfully absorbed into world C&C production, which has declined from a peak of 74.3mbd in May 2005 to its most recent value of 73.5mbd in Sept. 2007.

So, despite all of these collapse horror stories, world oil production has maintained a mild decline rate of 0.5% per annum since its peak in May 2005.
Personally, I see the slow decline of world C&C production since its May 2005 peak as confirmation of an important theory presented by Stuart Staniford and Jeffrey Brown of the Oil Drum. According to this theory, the decline rate of a region can be predicted from the y-intercept (k value) of its Hubbert Linearization. Here's a linearization for the UK by khebab:
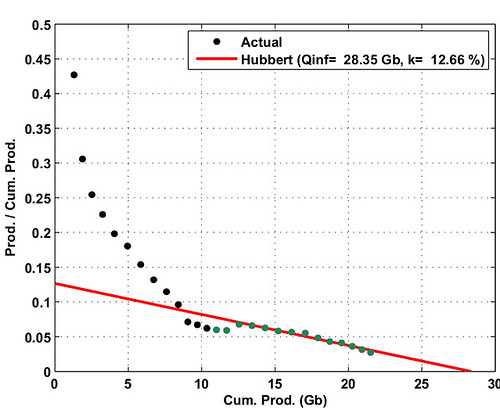
In this case, k=12.66%. So the theory predicts that, over time, the UK decline rate will approach 12.6%. This means that the high decline rate of the UK is not an unexpected violation of Hubbert Theory, but rather a confirmation of it.
Here's a linearization of Norway (also by khebab), another country often cited as going over a cliff:
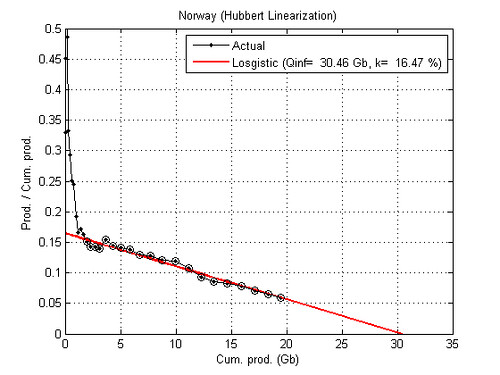
Note that k=16.47%. So the steep decline of Norway is, again, an expected consequence of the fact that production is following the Hubbert curve. The graph of Norway (actual drawn from BP figures, and theoretical from khebab's specs, URR=30460, k=0.1647, Peak year=2001) bears this out (click to enlarge):
 Production went up steep, and it's coming back down steep. The curve is symmetrical and there is no "cliff".
In all cases I have looked at -- UK (k=12.66%), Norway (k=16.47%), US (k=5.4%) and the world (k=5%) -- the severity of the post-peak decline is indicated well by the k-value of the region's Hubbert-Linearization. In fact, I am confident enough in this method to stir the pot and make a prediction.
JD's Prediction: World C&C production will decline at an average annual rate of 1% for 15 years after the world C&C peak (whether that be May 2005, or some future date).
by JD
posted by JD @ 10:02 PM
8 comments
![]()
![]()

8 Comments:
I would beleive these charts to be somewhat accurate if not for the lack of easely produced oil but for the lack of use of oil. this could have been achieved if the United States Congress had the Gulliones (That's Italian, I think for something that our Speaker of The House doesn't even possess.) to pass an enegy bill that contained help for renewable solar and wind. Instead they passed a bill that will just promote more use of liquid fuels and also please a lame duck oil soaked president(?) J.C., Sr.
ugh, i can only handle about 2 charts per post (and only 1 showing the hubert curve). it's why i stopped reading theoildrum.com. sometimes i just think a lot of the folks who post there are people who love to crunch numbers and generate charts in excel (or whatever software they might use).
the problem with statistics is that 95% of them are wrong.
This is supposed to be a peak oil DEBUNKING blog and the point of this post is that oil did peak but the curve is going to be milder than the average peak oiler thinks? That's not exactly peak oil debunking. That's admission that you are wrong and the peak oilers are at least technically right. Oil doesn't have to go down dramatically to have a negative effect given increased demand. It will just moderate how bad the sh*t hits the fan.
"blogger", read the top of the page
Blogger, you are an idiot. Read some old entries before spouting off your nonsense. JD has always maintained that oil will peak, but that it will not be the end of society. We will adapt. His whole point is to debunk the doomers.
Oh sh*t, we already peaked?!? Why didn't I get the memo?!? I need to catch up on my anarchy, hopelessness, despair, etc. Is deep frying my cat using the fat leftover from filleting my wife acceptable, or is it considered cheating?
Then don't call the site Peak Oil DEBUNKED. It should be called "Peak Oil Might End Up Not Being So Bad, And Certainly Not The End of the World".
i agree with previous commenter. coming here i thought i would read articles on how hubbert is wrong, etc (which would be pretty hard to write since he correctly estimated US peak correctly). it seems the disagreement is simply on the time of the peak - on the "when" not the "if".
i understand the blog is against the doomsday scenarios which I am against as well actually. we will adapt, but in between the "next best thing" and $200/barrel oil, there could be some rough times.
Post a Comment
<< Home