238. MORE FUN WITH "THE GROWING GAP"
As we have seen, Colin Campbell and the peak oilers like to show that we're in big trouble because oil discoveries have peaked and are relentlessly declining, as shown in the frightening graph of the "Growing Gap" which is Exhibit A in peak oil circles:
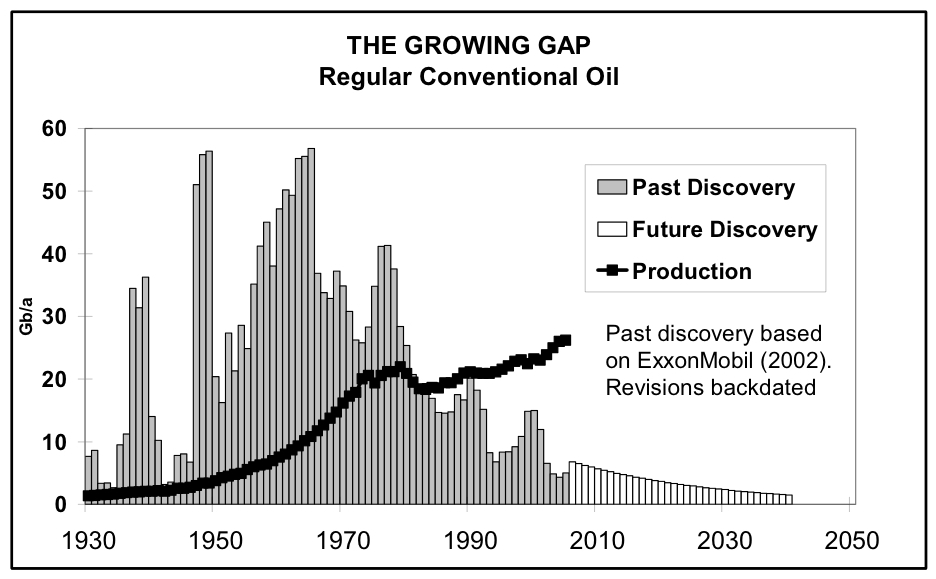
We have also previously noted that Colin Campbell defines "oil" very narrowly, and does not include oil sands and heavy oil as oil, even though the syncrudes produced from them have the same chemical composition as oil, and are refined, marketed and used just like oil. I've often wondered what the "Growing Gap" would look like if we included the discovery of the Venezuelan and Canadian tar sands. I've done the calculation, and here's what the picture looks like:

The little tiny smudge at the bottom is Campbell's graph of the "Growing Gap", reduced to make the size of the diagram manageable. (The height of that box is 60Gb). The grey line coming up from the middle indicates the discovery of the oil contained in Venezuelan and Canadian tarsands deposits (a total volume of 3,500 Gb). For improved visibility, I made the long grey line about twice as fat as it should be, and arbitrarily set the date of discovery for the tarsands around 1960. Kind of puts a whole new spin on the situation, doesn't it?
-- by JD
posted by JD @ 6:24 PM
9 comments
![]()
![]()

9 Comments:
Roland is right. I originally drew the line thin, but it was very hard to see. If it was drawn to the same width as the bars in Campbell's diagram, the width would only be a fraction of a pixel. In fact, at this scale, Campbell's diagram is only 7 pixels wide.
Also it isn't actually 3500GB of 'oil' is it? The bitumen needs upgrading so it's not a like for like comparison.
Yes, that's true. But nevertheless, synthetic oil is still oil, and it should be factored into the discovery curve somehow. Even according to ASPO, we are currently producing 2.3mbd in heavy oil. As the peak oilers always say: "To produce oil, you must discover it first." Therefore: Since we're producing the oil, we must have discovered it, and its discovery needs to be factored somehow into any honest discovery curve. QED.
Sorry, that should be "15 pixels wide" not "7 pixels wide". The height is about 7 pixels.
Chris,
I've redrawn the diagram to reflect your criticisms about the width of the bar. I like your idea about using a block too, and I'll add that when I get a moment.
Beautiful Chris. Thank you.
The thin line just doesn't look as funny.
Dang it! ;-)
Chris's diagram isn't as flashy, but it's definitely thought provoking. 70Gb discovery (higher than any year on Campbell's chart) for 50 straight years. Wow!
JD,
you used the OOIP for tar sands instead of the URR (~300Gb for canadian tar sands). The URR for tar sands is estimated between 400 and 600 Gb depending on technology. As said Chris, the production rate from tar sands will be small and is supposed to reach 5mbpd in 2015 after heavy investment.
Chris and Khebab,
Of course you guys are right about production rate. There is no way we are going to continue the status quo with tar sands and Orinoco heavy. There are huge technical and political barriers which will prevent that.
And khebab, I know I used the OOIP. It did it partly tongue-in-cheek, to stimulate thought. But I think there is a good happy medium in this case. We shouldn't take Campbell's approach of ignoring the discovery of tarsands/heavy altogether, and at the same time we shouldn't take my smart-ass approach of using OOIP either. Tar sands discoveries should be added to the discovery curve in amounts reflecting their current ability to contribute to production. I.e. the "flagpole" should be about 10 times taller than Campbell's chart, rather than 60 times taller.
That said, I'm still skeptical about the idea of URR for the tar sands. A URR of 600Gb assumes that there is a point beyond which advances in technology cannot improve recovery rate.
Suppose, as a thought experiment, that I add the 600Gb flagpole in 1960. Then time goes on, and a new miracle technique is developed which allows us to get the whole 3,500Gb. (I know that's impossible. It just makes the example simpler.) Where do I add the new 2,900Gb to the discovery curve? If I backdate it to 1960 with the original 600, then that would mean all 3,500 was discovered 40 years ago, so why is it illegitimate to add that 3,500Gb now? If you are going to later say (following Campbell) that "we really discovered that oil in 1960", then that means it has already been discovered *now*, so why can't we add it now?
Given the obvious value of oil, we may eventually recover a very large fraction of heavy oil through intensive investment and technological progress. So if the eventual URR is high, that means we should add that URR now to 1960 (or whatever date we choose as the date of tar sands discovery) because we're just going to add it there later anyway.
It all boils down to this: How is it that we can presume to know what *ultimate* recovery is now? It's like predicting how many days you will live. It's impossible to answer the question with certainty until after the fact.
It doesnt really matter if your graph reaches the moon, JD. the absolute size of resources are irrelevant. What matters is rate at which they can be extracted. Available energy in the form of natural gas, water and maybe capital and environmental considerations are likely to restrict the rate at which the Canadian tar sands can be converted to oil.
Is Oil shale ever going to get off the ground as an energy source... hmm.. http://www.econbrowser.com/archives/2005/09/oil_shale_retor.html
It doesnt really matter if your graph reaches the moon, JD. the absolute size of resources are irrelevant. What matters is rate at which they can be extracted.
I agree, as I said above. That still doesn't solve the problem of explaining how we're producing oil from a source which (according to Campbell) isn't really oil and was never discovered. Do you agree with me that some portion of the tar sands should appear somewhere in the discovery curve?
Also, I'm not at all sure what the maximal rate of production from the tar sands is, or how much oil we will eventually recover from them. Are you?
In a way, tar sands are the best oil source. You can't pump them very fast, so they have two virtues: they will slow down our consumption, and they will last a very long time.
Post a Comment
<< Home