230. THE GROWING GAP
One of the great foundations of peak oil theory is the following graph of declining discoveries, drawn by Colin Campbell and endlessly reproduced within the peak oil community (click graphs to enlarge):
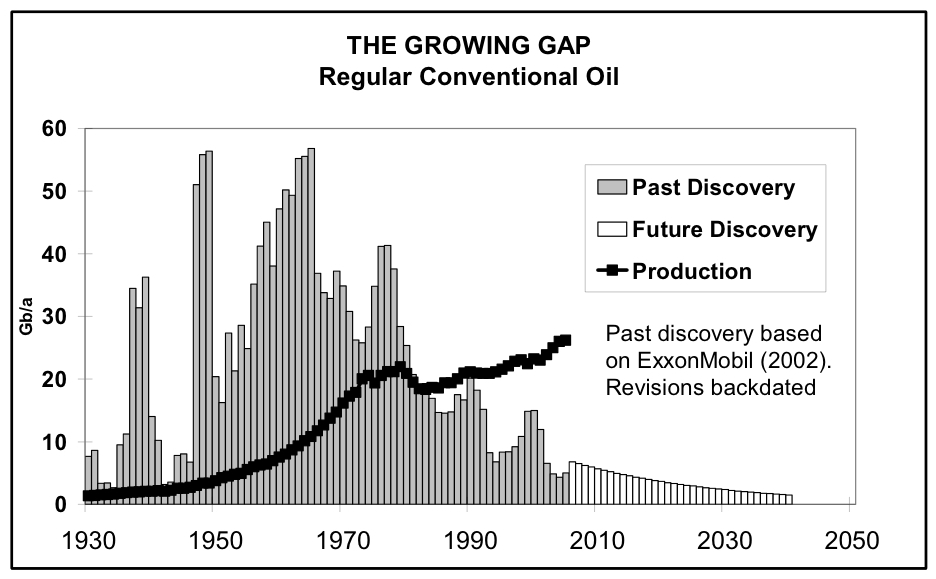
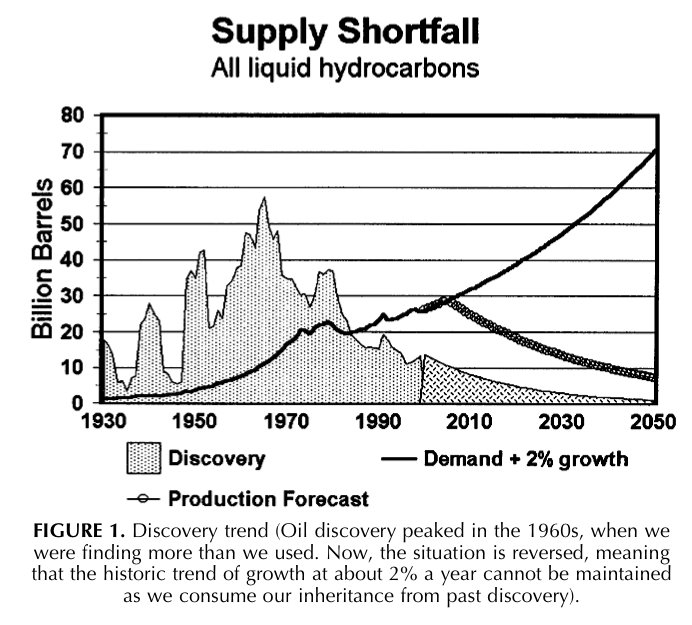
The above is the just the latest version (from the February 2006 ASPO newsletter). The graph has gone through a number of mutations over the years. It apparently appeared for the first time in an article by Colin Campbell called "Petroleum and People" in Population & Environment v. 24, n2, 2002. This is what it looked like then:
Notice the many interesting differences between the charts:
1) The 2002 chart is labeled "All liquid hydrocarbons", while the most recent 2006 chart is labeled "Regular conventional oil" (which is defined by Campbell to exclude oil from coal, bitumen, heavy, deepwater, polar and gasfield NGL). This is an ongoing slow-motion backpedal by Colin Campbell. The chart starts as "All liquid hydrocarbons" in 2002, becomes just "The Growing Gap" from March 2003 (when the curve started appearing as a regular feature in the ASPO newsletter) to Dec. 2004, then changes to "Regular Oil" in Jan. 2005, and once again changes to "Regular Conventional Oil" in Jan. 2006. The fact that this chart only applies to a very narrowly defined class of oil, which Colin Campbell calls "Regular Conventional Oil", is a grave problem for the argument here. The chart excludes the "discovery" of, for example, the Alberta tar sands, heavy oil in Venezuela, NGL (which is routinely counted as oil production), coal to liquids, the upcoming surge of GTL projects, ethanol and biodiesel. Coal reserves, for example, ARE oil reserves, as I noted in #43. COAL LIQUEFACTION. So why don't coal discoveries factor into the curve? Or sugar cane ethanol "discoveries"?
2) Also note how the shape of the graph has inexplicably mutated. The 1940 spike, which was about 27Gb in the 2002 graph, has grown to about 35Gb in the 2006 graph. Similarly, the 1950 spike of 42Gb in the 2002 graph has grown to about 55Gb in the 2006 graph. Apparently about 50 new Gigabarrels (i.e. about four Prudhoe Bays) magically appeared from somewhere between 2002 and 2006. This seems to suggest that the whole past curve is in flux. So how can you extend a trend when the thing you are trying to extend is still changing?
3) Where's the 26Gb from Azadegan in 2001, and the 38Gb from Ferdows/Mound/Zagheh in 2003? (See #228 below.)
4) Note that the 2006 chart gives "Exxon/Mobil 2002" as a source. Apparently this "citation" (I'm using that term derisively) refers to a chart drawn by Harry J. Longwell, Director and Executive Vice President of Exxon/Mobil, in an article called "The Future of the Oil and Gas Industry: Past Approaches, New Challenges" in World Energy, Vol. 5, No. 3, 2002. Here's the graph from Longwell:

Here's Colin Campbell's remarks on the Longwell curve (from ASPO Newsletter #25):
It is also noteworthy that [Longwell's] past discovery trend is an exact replica, down to the smallest detail, of an ASPO plot published by Campbell in Population & Environment v.24 n2. 2002.Hmmm. Kind of makes you wonder if Longwell just copied the drawing from Campbell's 2002 paper. It's also deceiptful to cite Exxon/Mobil as the source of the data. The paper was written privately by Longwell, an employee of Exxon/Mobil, not by the corporation itself.
5) Which brings us to the real dirty little secret of the peak oil community:
Despite the fact that this graph is a critical centerpiece of the peak oil argument, NOBODY KNOWS OR EVEN CARES WHERE THIS DISCOVERY DATA CAME FROM. Yes, we have this nice series of crayola drawings, but where did the underlying numbers come from? Longwell's paper is a puff piece which doesn't have any notes. Same for Campbell's puff piece in Population & Environment.
Clearly this has the stink of pseudo-science all over it. Genuine scientists do not accept graphs when nobody has a goddam clue where the data came from, or how it is being updated.
-- by JD
posted by JD @ 3:59 AM
8 comments
![]()
![]()

8 Comments:
JD - point taken, but how about you try putting together your own curve, to compare with?
Hi arthur, welcome to POD.
I'd love to make my own curve, or at least analyze the raw data and methodology, but the data isn't available. It would be a big job even if it was.
It would be a great step forward if Colin Campbell would disclose his underlying data, but I doubt that's going to happen.
At some point I may take Campbell's chart, and Photoshop in some of the most obvious omissions, like the discovery of the Alberta tar sands, heavy, deepwater, the recent Iranian super-giants etc.
chris l,
Consider GTL. Shell is investing $5 billion in a GTL facility in Qatar which will produce 140,000bbl/d of diesel when it is completed in 2011. A barrel of crude, on the average, is 20% diesel. So, in terms of diesel, the Shell GTL plant will be the equivalent of an ordinary crude source producing about 700,000bbl/d. That's quite large -- roughly the same as the oil production of an entire country like Egypt, Australia, India etc. For reference those countries have current oil reserves of about 4 Gb. So, from the standpoint of the diesel market, we could say that the Shell plant is the equivalent of the discovery of an oil field about 4Gb in size. Assuming the entire $20 billion of scheduled investment goes through, GTL in Qatar will be the equivalent of a 15Gb super-giant oil field discovery. That would definitely put a big out-of-trend spike on Cambell's curve.
Similarly, in terms of gasoline substitution, worldwide ethanol production is the equivalent of an ordinary crude source producing 1mbd. This is roughly equivalent to the production of Indonesia, which has proven oil reserves of about 4 Gb. So ethanol is equivalent to discovery of a giant 4Gb field, except this is a bottomless field which is renewable and doesn't deplete at all, so it should probably be estimated as a sort of super-super-giant. That would put another out-of-trend spike on Campbell's chart.
Yes, you're right that adding alternatives would ruin Colin Campbell's chart -- just like including kerosene would have ruined the whale oil discovery chart. That's why he doesn't include them. But it's a losing battle he can't win. People will call GTL diesel and biodiesel "diesel" because it is functionally identical to diesel, even though it isn't "really" diesel, and the same is true for other alternatives. If you follow Campbell, you'll end up "right" about a pedantic distinction which is irrelevant to the real world. Sort of like one of those old school marm types who scolds you to say "May I have a cookie?" instead of "Can I have a cookie?"
You're right that conventional oil will be very important for a long time to come, but we have to recognize the impact of all liquids, and a good graph should accept that. Yes, it's going to cause a big mess. Everything will need to be rethought, and it will ruin the tidy "Growing Gap" fairy story. But sometimes the theory has to evolve because reality is complicated.
Let's say that conventional oil production continues to grow by 2% and peaks by the year 2010 at 94 mb/d. And let's say that the base annual decline is 4% thereafter. That would mean that we would need 3,760,000 boe/d of substitute liquid fuels by the year 2011.
According to Colin Campbell, conventional oil production (as defined by Campbell) already peaked in the Spring of 2004, two years ago, at around 65mbd (See #52. PEAK OIL ALREADY HAPPENED and Freddy Hutter's Trendlines for details.) So, according to your reasoning, we've already lost about half a Saudi Arabia (5mbd) in the last two years. Nevertheless "oil" production has not declined, and in fact has increased by about 3mbd (82mbd->85mbd) since Spring 2004. How do you explain that? Where did all this supposedly irrelevant "oil" come from?
Now, the GTL diesel will be very high quality, but overall the Shell GTL plant is equal to oil production of just about exactly 140,000 bpd.
No, the Shell GTL plant is equal to oil production of 140,000 bpd + an on-site refinery which converts 100% of that amount into diesel. AFAIK, there are no such facilities in the world today. Therefore, the Shell plant will have an impact on the diesel market numerous times greater than a simple 140,000 bpd crude source. That is the point I am making.
Basically, what is happening is that alternatives like GTL and ethanol are side-stepping the entire "crude oil" phase of liquid production, and targeting the retail product markets (gasoline-type liquids, diesel-type liquids) directly. Unlike crude, they are already refined at the primary production site. So the comparison to crude oil just makes things confusing. Look at it this way: the Shell GTL plant will produce 140,000bpd of diesel, but world production of diesel is only about 17mbd (i.e. 20% of 85mbd). 140,000bpd is a lot bigger slice of 17mbd, than of 85mbd. Comparing diesel directly to crude is apples and oranges. For a person operating in the diesel market, there is a huge difference between: there's 140,000mbd of new crude coming on line soon, and there's 140,000mbd of new diesel coming on line soon.
Sorry, the last two figures should be 140,000bpd.
all discovered liquid hydrocarbons IS THE SAME as conventional oil.
You refer to nonconventional oil, coal liquification, bitumen, etc. . . . those are not liquids.
Is liquified coal a liquid hydrogen? Yes. But you can't 'discover' it. You discover coal and then liquify it.
So your argument is piss poor. If you want to talk about nonconventional oil, fine. But you are undermining your own view by making such stupid illogical arguments as this one.
good points to think about as i search around the web, I used to believe peak oil had already occured, but with all the new discoveries lately im thinking bout ging to get a jeb in north dekoda,lol. I just want to be able to drive my baby around for a few more years before i have to convert to natural gas, i also would like my kids to be able to have the same feeling of getting you first car, snd doing some burnouts you know
Post a Comment
<< Home