For this calculation, I will draw figures from EIA "Table 2.9: World Production of Primary Energy by Energy Type and Selected Country Groups (Quadrillion Btu), 1980-2005", located
here.
I will use the following abbreviations to indicate the components of the global energy supply:
L: Liquids. This is listed as petroleum in Table 2.9. It includes ordinary crude oil, condensate, NGL and tarsands.
G: Dry natural gas, not including NGL.
C: Coal
H: Net hydroelectric power
N: Net nuclear electric power
R: Renewables*. Net electric power from geothermal, solar, wind, wood and waste.
Using these terms, world total energy production can be expressed as T = L + G + C + H + N + R.
In 2005, the amount which each factor produced, and it's percentage of the total were as follows:
L: 169 quads, 37%
G: 105 quads, 23%
C: 122 quads, 27%
H: 29 quads, 6%
N: 27 quads, 6%
R: 4 quads, 1%
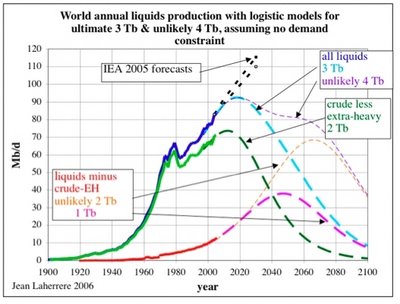
In the immediate aftermath of peak liquids, all of the other sources will be available to compensate for a decline in L. So (until peak G) the term "alternatives" will mean the aggregrate of G, C, H, N and R. As you can see, L accounts for a little more than a third of world energy production, so there is really no problem of scaling alternatives in the initial post peak-liquids phase. The alternatives are already twice the scale of the factor to be compensated for (L), and about 100-200 times the scale of the likely annual decline in liquids production (assuming a decline rate of 1-2%, see #327 below).
I've shown below (#327) that the net decline rate of liquids is likely to be less than 2% for decades. Now, liquids account for 37% of total energy (T), so a 2% decline in L gives rise to a (.02)(.37)= 0.7% decline in T. This, however, assumes that all the alternatives (G, C, H, N and R) do not increase. At what rate do the other alternatives generally increase?
The following Table shows the production figures (in quads) for the most recent available years (2001-2005) in Table 2.9. dG, dC, dH, dN and dR indicate the respective growth rates (as numbers; multiply by 100 for percent). Finally the lowest row shows the average growth rates over the past 5 years for G(2.9%), C (6.2%), H(1.5%), N(1.4%) and R(7.3%).

Now, if the alternative sources (GCHNR) continue growth at their current rate, which is conservative (for N in particular), then total growth in T due to growth in GCHNR will be:
(.029)(.23)+(.062)(.27)+(.015)(.06)+(.015)(.06)+(.01)(.073)=.0259=2.6%
Which is more than enough to compensate for the 0.7% loss in T due to the decline in L. That is, world energy production will continue to increase by about 1.9% per year, assuming business-as-usual growth in alternatives, even in the face of a 2% decline in liquids.
Now, there may still be some question about whether alternatives (GCHNR) can increase in the face of declines in global liquids production. Historical data shows that they can. Recall the
"Big Glitch", where global liquids production dropped by 14% over the years 79-83:

The
DOE Annual Energy Review 2006 gives the following world liquids production (in quads) for 79-83:
1979: 133.87 (crude) + 4.87 (NGL) = 138.75
1983: 113.97 (crude) + 5.46(NGL) = 119.33 (14% drop)
During this same time period:
Coal grew by +0.6%.
Natural gas grew by +4%.
Nuclear power boomed, rising +60%.
Hydroelectric grew steadily, rising +11%.
Renewables boomed, rising +44%.
Perhaps the best illustration of this principle, however, is peak oil itself, which (as of this writing) appears to have occurred in May 2005.

Oil showed no growth at all in 2005 and 2006. However, total energy consumption in 2005 was 2.9% higher than in 2004, and total energy consumption in 2006 was 2.4% higher than 2005 (
BP Statistical Review 2007). Peak oil is not stopping growth of total energy.
by JD
-------
*) Note that these figures ridiculously underestimate the contribution of renewable sources like solar to primary energy -- a point demonstrated by Hermann Scheer. For details, see
284. RENEWABLES PROVIDE A LOT MORE THAN A "TINY" FRACTION OF PRIMARY ENERGY.
 For liquids, we're clearly off the plateau and surging to a new level:


