free html hit counter Peak Oil Debunked: February 2006

Tuesday, February 28, 2006

251. SPACE: UNREALISTIC DREAM OR ECONOMIC OPPORTUNITY?

We've previously covered the possibilities of strong economic growth in the near future through exploiting space, emphasising the point that space may be a large part of what will allow economic prosperity post peak oil.

Many in the peak oil community naturally still reject any notion of space providing for a bright future. After all, Apollo was over 30 years ago and we still don't have moon bases, lately we have barely managed the maintain manned space flight, we don't have any solar powered satellites meeting our energy needs, and we don't see massive lobbying and investment into the space business, right? So how can this space stuff be anything but a dream?

At least this seems to be the line of thinking for many people, and certainly an aspect of the doomer mentality regarding space. But if space is going to be an economic boom, then perhaps it would be prudent to take a look at what economists and entrepreneurs think about the future of the space business. These are the people that will make it happen after all.

Over the past several days an enlightening series about space has been posted on CNNMoney.com, written for Business 2.0 magazine. The intro page can be found here, which contains several links to relevant sub topics.

I've selected a few quotes from the articles:

"Profits set to soar in outer space
Prepare for liftoff: The space business may be the most incredible new opportunity of your lifetime.
"

Worldwide government spending on space is soaring to $50 billion a year, a 25 percent jump over 2000. NASA represents only $16 billion of that total, but during the next 20 years, the U.S. space agency is likely to sign contracts totaling as much as $400 billion [...]

In 1998, private-sector spending on space applications began to exceed government spending, and the gap is widening. [...]

All have the potential to generate astronomical returns during the next decade.

-----
Building infrastructure is the first step, and here historical analogies abound. The federal government is poised to begin contracting with the private sector to deliver cargo into orbit, a trend that could nurture a market for civilian spaceflight in much the same way that airmail contracts from the Post Office spurred the development of civil aviation a century ago. Prize money -- the incentive that launched Charles Lindbergh -- is now being offered for everything from building a machine to extract oxygen from lunar soil ($250,000) to building an aircraft capable of delivering tourists to orbit by 2010 ($50 million).

-----
The final frontier has been mapped out, and it's almost time to open the business district. In the next 15 years, we could see zero-G R&D labs for Big Pharma and tech companies, solar-power satellites saving Earth from fossil-fuel addiction, and sports arenas hosting events that make the X Games look tame.

[...]

It seems fanciful, but the profits will be very real--as much as $115 billion in the next 15 years. And if you want to cash in earlier, one tycoon is offering $50 million to anyone who can deliver tourists to his soon-to-launch orbital hotel.

[...]

For entrepreneurial ideas, the sky is no longer the limit.
Of course these are just stupid economists who have false beliefs in infinite growth paradigms and have no understanding of the affects of depleting resources on world economies. Of course most of the people investing big dollars in these ventures are among the most successful business people in the world, but hey, what do they know…
-- by Omnitir

Monday, February 27, 2006

250. THE OIL WEAPON IS A BLUFF

Over the weekend, there was yet another oil weapon threat from Venezuela:
Venezuela could easily sell oil to markets other than the United States and is prepared to end exports to its No. 1 buyer if needed, the oil minister said in comments published Sunday.

[...]

"If our country, our process, our constitution are attacked by the Bush administration, we are not going to send any more oil," Oil Minister Rafael Ramirez told the Ultimas Noticias daily in an interview. "We'll see then which of the two governments is able to manage this type of a situation better."Source

This is really getting tedious. I'm not going to bother going back and making an actual count, but this is like the 9th time they've said that. Chavez and Iran are like a couple of Schnauzers out in the back yard yapping away. Here's my message to Hugo Chavez: Bring it on, dude. You know the U.S. hates your guts and they're out to get you, so stop yappin' and PULL THE TRIGGER.

Something is very fishy about this "oil weapon" business. If the oil weapon is so scary, how come people only talk about it, and never actually use it?

To answer this question, we can turn to a superb recent paper entitled Oil market power and United States national security by Roger Stern of John Hopkins University. The paper appears in the Proceedings of the National Academy of Sciences (PNAS), and is currently the most-read article on the PNAS website.

Roger's thesis boils down to this: The security threat to the U.S. is not states like Venezuela and Iran cutting off oil to the U.S. Rather, the actual threat is states like Venezuela and Iran NOT cutting off oil to the U.S. The reason for this is that the OPEC countries enjoy cartel power over much of the remaining oil, and thus can inflate the price by dragging their feet and stifling production. This causes the market price of oil to be far above the competitive price it would sink to if (for example) Venezuela was in Florida, and Saudi Arabia/Iraq/Iran were located in Texas, where the fields could be exploited in a competitive, free market environment. Roger calculates the differential between these two prices, and shows the massive scale of wealth transfer to OPEC which is achieved through this cartel power -- a flow which fuels and buttresses the enemies of the U.S., and makes them stronger.

Thus it's all a paradoxical game. In reality, the oil weapon has no teeth. Suppose, for example, that Venezuela pulls the trigger and stops exporting to the U.S. This will cause price in the U.S. to rise relative to the world market, which will create a huge temptation to make an easy profit by selling back into the U.S. market. Chavez will sell it to China, and China will sell it to the U.S. Ka-ching$$. This is the same reason why the apartheid embargoes on South Africa were very porous and ineffective. Of course, to solve this problem, Chavez or Iran could go for the jugular, and stop exporting oil entirely. But this would hurt them way more than it would hurt the U.S. The U.S. would have to deal with slightly higher gas prices. Venezuela or Iran would have to deal with massive trauma to their governmental revenues.

Want to see the oil weapon in action? Here you go:
Yet despite the stark repercussions expected, the U.S. defied demands that Israel be forced to return to its 1967 borders and further traduced supplier wishes by providing arms to Israel during the October 1973 war. The oil weapon was soon unsheathed in response.

Arab producers promised a 5% cut every month until Israel returned to its 1967 borders and a selective embargo against the U.S. and Holland (ref. 1, pp. 89–140). However, the problem of third-country sellers soon impressed itself on the suppliers. By November, there was no further 5% cut. By January, Saudi Arabia and Kuwait, the only large producers participating, were increasing production (14). An earlier 1967 embargo had been abandoned just as quickly (ref. 1, pp. 89–140).[p. 1651]
Roger concludes (I'm paraphrasing in my own style here) that if the U.S. really wants to kick its enemies in the nuts, reduce funding for terrorism and break the cartel, it should do what they really fear: take demand side measures in the U.S. like signing the Kyoto treaty or passing a steep fuel tax.

Don't take my word for it on all this. Please read the paper. Not only is it inspired; it is also full of interesting, behind-the-scenes details on U.S. geopolitical policy. The following part is absolutely astounding, and shows how far the U.S. government will stick its head up its ass to continue the policy of appeasement:
Sheikh Yamani warned OPEC that Kyoto implementation might reduce global demand by 20x10^6 bd (57). The cartel subsequently claimed that it should be compensated for revenue lost to Kyoto-based demand reduction (58). OPEC's legal theory is that its prospective losses are equivalent to those of low-lying island states seeking compensation to manage sea-level rise. The U.S. supports OPEC (59).

[...]

Although fear of the oil weapon has changed little since Akins, appeasement has had to change with the times. Longstanding passivity to economic predation is now complemented by toleration of Saudi support for terror propaganda. Recently, the U.S. began to support the cartel's Kyoto formula: that monopoly rents are an entitlement owed by the world to OPEC (59). Thus, the 1958 law asserting that imports will "impair the national security" should some adversary decline to sell is balanced by a proposal to compensate the adversary should we decline to buy. If adopted, such a policy might perpetuate security threats no matter how low Kyoto forced demand. [pp. 1654-1655]
-- by JD

Friday, February 24, 2006

249. THE ECO-COLLAPSE OF EASTER ISLAND IS A MYTH

Easter Island plays a key role in peak oil theory as a metaphor for the earth. Its "eco-collapse" is regarded by peak oilers as a moral tale, which shows us what is in store for modern civilization if we don't get our act together and powerdown. Here's a typical description of the peak oiler view by lawnorder at the Daily Kos:
Disaster on Easter Island: When Nature trumps Economy
This is what happened in Easter Island:
Ever more wood and rope were needed to move the effigies, but a growing population, coupled with the drive for bigger and bigger statues, wiped out the trees. ... given the island's extremely fragile ecology, they didn't grow back.

1. For some reason those huge statues were all the rage and every tribal chief wanted more, bigger and better statues.
2. But no matter how much money or prestige was showered into the statue builders, there came a time that there were NO MORE RAW MATERIALS to make them.
3. Importing them from other places was impossible with the islanders' technology at the time, since Easter Island is pretty isolated.
4. And then the economic fueled hunger for raw materials started an ecological disaster: Deforestation, i.e, all trees of the island were cut to cater to the "statue making industry".
5. By cutting all trees, the islanders created an even bigger ecological problem: soil erosion, wildlife migration. Which in turn made the yield of food from harvests and hunting decrease significantly and brought the onslaught of famine...

A deforested island suffered from soil erosion and a lack of food and raw materials. Starvation, a population crash, cannibalism, and social collapse followed. (2)

This story of Easter Island's ecological suicide was popularized by the best-selling environmentalist author Jared Diamond in a book called Collapse: How Societies Choose to Fail or Succeed. The book has become one of the "core texts" of peak oil theory because it shows how a complex society can collapse into starvation, warfare and cannibalism due to myopic consumption of a critical resource (wood for the Easter Islanders, oil for us moderns).

As went Easter Island, so will go modern society...

That's what the peak oilers say, and it would all be very scary except for one critical fact: Jared Diamond's theory is a fairy tale. He made the whole thing up for propaganda value.

This fact is demonstrated in an extremely interesting paper called From Genocide to Ecocide: The Rape of Rapa Nui* by Dr. Benny Peiser of the Faculty of Science, John Moores University, Liverpool. By judiciously sifting through original sources and archeological research, Dr. Peiser tracks Jared Diamond to his lair, and shows how Diamond's scholarship is marred by biased gullibility, selective quoting and a deep-seated agenda. Peiser's conclusion is that the complex culture of Rapa Nui (Easter Island) never self-destructed in a late 17th century spasm of starvation, warfare and cannibalism due to the ecological myopia of its native inhabitants.

The facts show, rather, that Rapa Nui's high culture was destroyed by the predations of the Europeans who murdered, raped, enslaved, mass deported, infected and Christianized the island's inhabitants -- well-documented facts which Diamond conveniently fails to mention. In short, Diamond's theories of the collapse of Easter Island are an elaborate, borderline-racist example of deflecting attention from the true perpetrators, and blaming the victim.
-- by JD
-----
*) Energy & Environment, Volume 16, No. 3&4, 2005. Many thanks to Robert Schwartz for this enlightening link.
**) More on this topic here: 260. MORE EVIDENCE DEBUNKING THE ECO-COLLAPSE OF EASTER ISLAND

248. ROB MCMILLIN ON THE SLIMY UNDERBELLY OF PEAK OIL

Recently I had the good fortune of being contacted by Rob McMillin, author of the Peak Oil Optimist blog. Rob is an excellent writer, with common sense values and the guts to stand up for them, and from time to time he takes on the "die-off" vermin who infest the peak oil community.

In an article last year, he exposed some of the unsavory thinking behind the "science" over at ASPO:
ASPO's Smirking, Malign Fascists
I have already recorded my contempt for those who would stand by and condemn the world to a fate of mass death. It's one thing to hear such shrill pronouncements from peak oil's homicidal wing, but quite another to hear it from those attempting to pass themselves off as academics. This week, ASPO published the most inhuman comment I've yet read from them in their Newsletter 52 (PDF). Regarding their opinion of the fate of a post-industrial India:
How India will fare during the Second Half of the Oil Age is hard to predict, but disintegration is a possible outcome, as people revert to their old communal and religious identities, a process which will probably be accompanied by much bloodshed and suffering. Clearly, the present population far exceeds the carrying capacity of the land, but the Indian is blessed by a smiling, benign spirituality that helps.
(Emphasis mine.) I stroke my beard; I bite my tongue. The vileness swimming in that last sentence recalls the twentieth century at its worst moments. I haven't the black depths of pen to heap upon the authors of this sewage the kind of scorn they so justly deserve.
Of course, this no surprise to the informed reader, considering that ASPO (an ostensibly scientific organization) has also published a fascist screed suggesting that the elderly and handicapped should be exterminated as a means of coping with peak oil.

More great articles from Rob in the same vein:
Tempting Godwin: The Primitivist Green SS
If We Open The Seacocks, Is The Ship Unseaworthy?

The comments are half the fun. Jason Godesky from Anthropik will light up your life, with choice quotes like this: "My own journey down that dark road of relinquishing the hubris that I know good and evil began with Daniel Quinn's Ishmael, and realizing that feeding starving people in the third world was far more cruel than watching them die."

Jason's got lots more zingers where that came from. A recent post begins:
The Stone Age is making a comeback. It doesn't matter if we want it or not. Collapse is inevitable; civilization is unsustainable, and it must end soon, one way or another. The key to survival is to separate ourselves from our doomed civilization, to ensure that when it dies, we are no longer dependent on it. Critics of primitivism like to point out that the Stone Age way of life is only viable if some 99% of the world's population dies off. They are right; but we face precisely that in the near future. There is nothing that can change that, but we can change how we react to that fact. As we saw in thesis #20, thesis #27, and thesis #30, collapse is not necessarily such a bad thing. It is far preferable to the alternative. Every human being will be faced with a choice: to die as civilized people, or to thrive in a new Stone Age.
Kind of makes you wonder why allegedly moderate peak oil sites like the Oil Drum are linking to these neanderthals. Oh yeah... I forgot... Their hero, Kenneth S. Deffeyes, retired Professor of Geology at Princeton, says "By 2025, we're going to be back in the Stone Age." Maybe Ken should get in touch with Jason and they can trade loincloths.
-- by JD

Thursday, February 23, 2006

247. THE SPACE ELEVATOR

Following on from Roland's nanotech post and the posts about industrialising space, it is time again to take a look into the not too distant future and surmise what may be in store for civilisation post peak oil – and contrary to current doomer beliefs, it ain't the stone age by 2025!

By now most people are aware of the modern space elevator concept - a lightweight but ultra strong cable (or more likely a ribbon) reaching to and beyond geosynchronous orbit, allowing climber cars to cheaply carry large payloads into space. The space elevator may sound ludicrous to some people, but the science supporting it is solid and well studied. And as Roland pointed out in his nanotech post, the technology to build the necessary material for the ribbon – structured carbon in the form of the carbon nanotube (CNT) – is rapidly evolving.

Carbon Nano Tube Tether
We know that CNT's have the tensile strength and are lightweight enough to do the job of building a space elevator, and the main issue now is manufacturing enough material at the required strength. For a long time the biggest hurdle was perceived to be the ability to produce any strength CNT at useful levels, and predictions on when this mass production breakthrough would occur were generally estimated to be well beyond the end of this decade. But then in mid 2005 a dramatic breakthrough in CNT manufacturing capability occurred:
A team of researcher from the University of Texas, Dallas, and Australia's CSIRO has come up with a way to make strong, stable macroscale sheets and ribbons of multiwall nanotubes at a rate of seven meters per minute.
This breakthrough was quickly applied to many CNT R&D efforts, and already several companies have further advanced the technology, leading the way for wide scale commercial applications and further progress. Bayer is one such company. From yesterdays press release:
...scientists from Bayer Technology Services have succeeded for the first time in producing high-quality carbon nanotubes on an industrial scale at considerably lower costs than before. They are considerably stronger than steel, enable electricity to travel through plastics and improve the mechanical properties of ceramic materials.
At current production capabilities, it would take less then two years to manufacture enough CNT material to construct the ribbon. The main hurdle remaining is for the product of this industrial scale manufacturing process to reach the appropriate tensile strength, an attribute that is frequently improving. It appears to simply be a matter of waiting for the CNT industry to mature.

Given the leaps and bounds that CNT technology has been making, it is expected that by the end of this decade they will either meet the technical requirements for building the space elevator or be proven infeasible for the job for the foreseeable future. The organisation Elevator: 2010 have an outlook revolving around this notion:
We firmly believe that the set of technologies that underlie the infinite promise of the Space Elevator can be demonstrated, or proven infeasible, within a 5 year time-frame. And hence our name. Elevator:2010. we promise to get an answer for you by then.
The infinite promise of the Space Elevator
The bottom line is that a space elevator would make launch costs negligible – which is the biggest barrier against large-scale utilization of space. It's currently several thousand dollars per kilogram to launch into low orbit, and around twenty thousand dollars per kilogram into geosynchronous orbit. The space elevator would lower costs to around a couple of hundred dollars per kilogram, possibly much cheaper. While this level of launch cost reduction is by no means necessary to industrialise space, it would certainly make for rapid and wide-scale utilization of space, catapulting economies the world over into record levels of prosperity and growth.

Though however important the dramatic cost reductions would be to space industrialisation, the advantages of the space elevator go far beyond making space more economical. Other important capabilities that the space elevator would provide include the following:

- Unprecedented launch turn-around time, with regular operations allowing launches every few days, as opposed to the months long average turn around times for rocket launches.
- Capability of lifting payloads far larger and heavier then previously possible.
- Gentle acceleration into orbit allowing for sophisticated and sensitive equipment, resulting in massive improvements in ComSat technology and a far greater understanding of the universe thanks to precise space based scientific equipment
- Ease of achieving low orbit, geosynchronous orbit, or escape orbit.
Low orbit and Earth's gravity could pull a re-entry vehicle to any point on the planet, geosynchronous orbit and any kind of platform, habitat or lab could be constructed without decaying orbits (unlike the ISS), or simply climb beyond the geosynchronous position and let go of the ribbon at the appropriate time and centrifugal force will catapult a space craft into any desired trajectory in the solar system.
- Space based power supply. A space elevator would easily allow for very large scale solar arrays to be established in orbit, collecting massive levels of uninterrupted and unfiltered solar radiation, and sending the power back to Earth either with microwave beams or down the highly conductive CNT ribbon itself. Theoretically a single space elevator could provide more electricity then any known source of power generation.

The development of a space elevator also has considerable benefits long before the system becomes operational. By focusing R&D on mass production of high quality CNT's, those involved with space elevator projects will find themselves at the forefront of a leading edge market with a rapidly growing client base.

Efforts towards the space elevator
LiftPort is a private enterprise striving to build a space elevator, and they understand the benefits of developing and marketing CNT's (and other elevator related tech) long before the space elevator is constructed. They have a sustainable business plan involving subdivisions of the company, LiftPort Nanotech and LiftPort Robotics, which will generate income from some of the component parts needed to build the space elevator such as CNT's and robotic balloon systems. So by striving to be profitable long before the space elevator is operational, they strive to stay in the game, as opposed to the unrealistic philosophy of an "all or nothing" long term approach to building the space elevator, which many opponents to the space elevator unwisely claim as the only way. Joe Julian, administrator of the LiftPort web site summed it up nicely in a discussion about space elevator economics:
Everything we do at LiftPort is geared toward finding shorter term "intermediate" businesses that can be profitable. High altitude robotics have a significant potential for observation, communication and science applications. Carbon Nanotubes are more valuable than gold. Beamed energy, communications, education, advertising... all these industries are profitable and they all relate directly to building the Space Elevator.

My concept of the LiftPort Space Elevator


NASA is also taking the space elevator concept quite seriously. In 1999 the NASA Institute
for Advanced Concepts (NIAC) held a workshop to investigate the possibility of developing a space elevator. A manuscript, entitled simply "The Space Elevator", resulted from a six-month investigation, marking the beginning of NASA's continuing research into the concept, and possibly marking the very beginning of a new age for NASA and space travel. From the manuscript's introduction:
The study had the same simple title as this manuscript, The Space Elevator. The study itself was far from simple however. The object was to investigate all aspects of the construction and operation of a space elevator, a concept that up until this time had been confined to the realm of science fiction.

For those of you who are pragmatic and down-to-earth, examine the details of this work and I hope it will convince you that there is an interesting development on our horizon.
In 2001 the NIAC commenced its more extensive and expensive Phase II technical and feasibility study of the space elevator concept, the report of which can be found here (PDF): The Space Elevator NIAC Phase II Final Report.
"The studies were quantitative and detailed, highlighting problems and establishing solutions throughout. It was found that the space elevator could be constructed using existing technology with the exception of the high-strength material required. Our study has also found that the high-strength material required is currently under development and expected to be available in 2 years."
It appears that the NIAC study has also found similar benefits to the space elevator that I listed above:
The return on the $570,000 NIAC investment could eventually become trillions of dollars annually and provide an energy-starved world with clean unlimited power, dramatically improved communications, new resources, new worlds to live on and the ability to understand our planet and the solar system around us at a level impossible with conventional rockets.
As well as investing in research, NASA has added a series of space elevator related challenges to their centennial challenge series, in the same spirit as the Ansari X-prize challenges. We can see how serious NASA is about the space elevator when we take a look at what other developments they are encouraging with their centennial challenges; new space suit parts, techniques for extracting oxygen from lunar regolith, beaming power, telerobotic construction, unmanned aircraft – all techniques and technologies NASA aims to develop in line with it's future ambitions. NASA appears to be placing equal importance to space elevator R&D as to it's current lunar initiative and future vision for space.

Costs
Cost estimates for building a space elevator are often estimated to be around the $10B figure, though some studies have estimated the figure as high as $40B. The development time is estimated to be around 10 to 15 years. These costs are comparable to the development costs and times for the space shuttle system, and considerably lower then the Apollo program. The return on these investments is easily in the trillions of dollars, though ultimately incalculable.

Disbelief
If riding an elevator into space (or for that matter industrialising space or building nano-factories) sounds like an impossible dream, and looking at the feasibility studies of these theoretical technologies is something you consider a waste of time, then at least consider the following quote:

"Heavier-than-air flying machines are impossible."
--Lord Kelvin, president, Royal Society, 1895.

In 1895 it was a small minority of individuals pushing to develop heavier-than-air aircraft, while society at large dismissed these individuals as crackpots. Yet against the overwhelming opposition of those insisting that it was impossible, less than a decade later the Wright's flyer took to the air, marking the beginning of a new era. This may not make things seem more realistic to the sceptics, but it should make them realise that every radical new technology ever developed seemed impossible before it became possible. Opening the mind to greater possibilities is the first step towards achieving what seems impossible.

Arthur C. Clarke said it well when during a speech he once gave, someone in the audience asked when the space elevator would become a reality. Clarke answered, "Probably about 50 years after everybody quits laughing." Commenting on this, Pearson, who contributed to NASA's 1999 workshop said: "He's got a point. Once you stop dismissing something as unattainable, then you start working on its development."

Given the serious attention the space elevator concept has received in recent years, as well as the current trends in CNT progress, and the number of business ventures pursuing space elevator concepts, it would appear that almost everybody has 'quit laughing'. Perhaps one of the main challenges now remaining, is not the maturing of CNT technology, or even the engineering challenges yet to be resolved, but the general attitudes towards the space elevator by the public.

Kenneth Deffeyes recently stated, "By 2025, we're going to be back in the Stone Age".
This prediction couldn't be further from our probable future. The ironic thing about this prediction is that by around 2025 the first space elevator should be fully operational, ushering in a new era for humanity that will be as different from our current stage of civilisation, as the industrial age was different from the stone age.

Just as cheap fuel was the catalyst for the considerable growth and progress of the industrial age, cheap access to space will be the catalyst for the near infinite growth and progress of the future. And the space elevator could be the tool for that cheap access to space.
-- by Omnitir

Wednesday, February 22, 2006

246. REMBRANDT ON THE "GROWING GAP" (PART TWO)

[Note from JD: This is a continuation of #241. As before I've added my follow-up questions/remarks in italics below Rembrandt's responses.]

Item 230: the growing gap

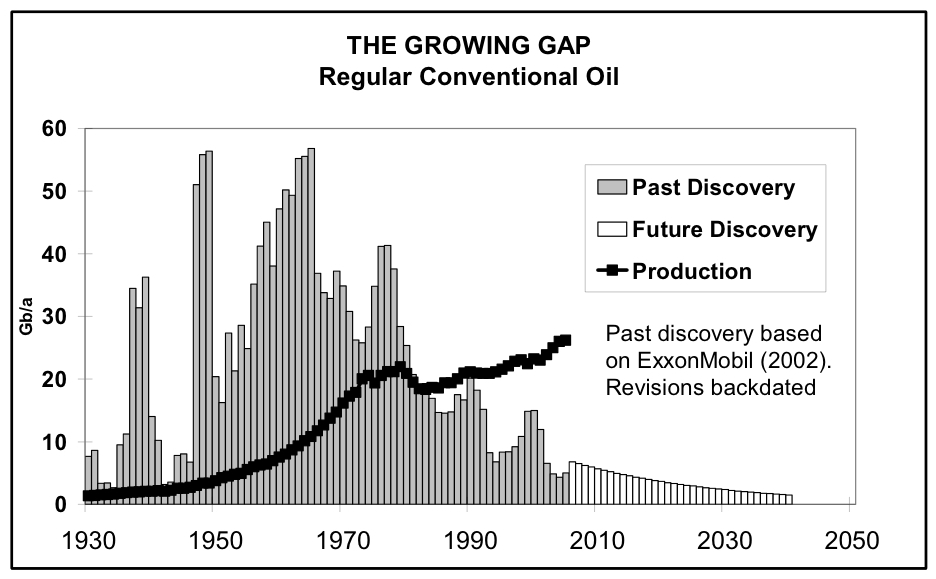
2) "Regular Conventional Oil", is a grave problem for the argument here. The chart excludes the "discovery" of, for example, the Alberta tar sands, heavy oil in Venezuela, NGL (which is routinely counted as oil production), coal to liquids, the upcoming surge of GTL projects, ethanol and biodiesel. Coal reserves, for example, ARE oil reserves, as I noted in #43. COAL LIQUEFACTION. So why don't coal discoveries factor into the curve? Or sugar cane ethanol "discoveries"?


This is a nonsense argument since you have to divide between production and reserves. Regular conventional oil has a production pattern that is very different than from coal liquefaction or tar sands or NGL and so forth. Describing the regular conventional oil discovery pattern therefore gives a reasonably good outlook for the trend. The only discussion point here is if you should include deepwater oil or not. In total, cumulative deepwater discoveries amount to approximately 70 GB. Campbell does not include deepwater in his discovery trends.

[JD's response: I still maintain that there is something fundamentally wrong with counting unconventional as production, but not as discovery. Even Campbell himself states, in the chart at the front of the most recent ASPO newsletter, that non-regular (unconventional) oil accounted for 17% of total "oil" production in 2005. Campbell's figure for non-regular production is 13.7mbd, significantly larger than the production of Saudi Arabia. To me, that seems a little too large to omit as irrelevant. Particularly if you are excluding it from the discovery side while including it in the production side, so as to conveniently accentuate the "gap". Even that 70Gb of deepwater alone would have a significant effect on the most recent years of the discovery curve. And what about NGL? It accounted for 6.9mbd in 2005 according to Campbell (a contribution roughly twice as large as deepwater, which was 3.6mbd). Why isn't NGL discovery included? I can understand your point about tarsands and CTL because the resource must be mined, but I don't think there is any significant difference in production rate between regular oil on the one hand, and deepwater/polar/NGL on the other. They're all liquids which are counted by everyone (except Campbell) as oil production. So why shouldn't they be counted as oil discovery?

Also, I would disagree that conventional discovery gives a good indication of the trend. According to Campbell, conventional production peaked two years ago, while your own research forecasts a liquids peak around 2012, roughly 8 years later. There's a significant disconnect between conventional oil trends and liquids trends.
]

3) Also note how the shape of the graph has inexplicably mutated. The 1940 spike, which was about 27Gb in the 2002 graph, has grown to about 35Gb in the 2006 graph. Similarly, the 1950 spike of 42Gb in the 2002 graph has grown to about 55Gb in the 2006 graph. Apparently about 50 new Gigabarrels (i.e. about four Prudhoe Bays) magically appeared from somewhere between 2002 and 2006. This seems to suggest that the whole past curve is in flux. So how can you extend a trend when the thing you are trying to extend is still changing?

The difference between the 2002 and 2006 graph is between taking the average from an approximate of years. The most recent graph shows the 3 year average trend. The 2002 graph probably shows a 5 year average trend. The size under the curves in both graphs, or in other words, cumulative discovery, should be exactly the same.

[JD: If the area under the two graphs is the same we have a big problem because the 2002 graph is for "All Liquid Hydrocarbons", while the 2006 graph is for "Regular Conventional Oil". Also, even assuming this rumor about a 3-year/5-year average is correct, Cambell is still guilty of shoddy scholarly practices. If a graph is smoothed with a moving average, the graph itself should have a note to that effect. Bona-fide scientists disclose all relevant information necessary to interpret their graphs.]

4) Where's the 26Gb from Azadegan in 2001, and the 38Gb from Ferdows/Mound/Zagheh in 2003? (See #228 below.)

The potential reserves of Azadegan amount to approximately 5-6 Billion barrels according the source of your number. Higher numbers have been cited at other sources. Azadegan comprises of 2 reservoirs, one having light (above 20 API) and the other having heavy oil (between 10 and 20 API). Ferdows/mound/Zagheh consists out of heavy and extra heavy (below 10 API). Since Campbell’s graph does not include extra heavy and heavy oil. The Ferdows/Mound/Zagheh discovery is not included in the chart. The amount of oil that could be extracted from the Ferdows/Mound/Zagheh complex is probably between 5% to 20% of the 38 Gb amount.

[JD: Yes, you're right it is going too far to include the total OOIP (Oil Originally In Place) figures. On the other hand, I still don't understand why Campbell does not count heavy oil as discovery, even though it is counted as oil by everybody (EIA etc.) when it is produced. "Heavy oil discovery doesn't count as oil discovery because Campbell doesn't count it that way" isn't a very good reason. Why is it that Colin Campbell is the one gets to decide what is oil, and what isn't?

I also find it odd that when we talk about adding a new field like Azadegan to the discovery curve, Campbell and the peak oilers insist on taking the smallest possible number for URR (to keep discovery numbers down). But when the URR eventually grows over time (through reserve growth), they reverse themselves and say that such growth must be backdated to the original year of discovery, thereby inflating the very same number they insisted on minimizing in the first place. Campbell and Laherrere often talk about how initial URR estimates are too conservative (thus leading to the "illusion" of reserve growth) but when they add new discoveries to their discovery curve, they insist that the initial URR numbers should be conservative. It's self-contradictory.]

Item 237. GLITCH IN CAMPBELL'S DISCOVERY FIGURES

1) Sooo.... What's going on here? Why are Campbell's numbers so low? Where is he getting them from? Why is it the industry has -- verifiably -- announced roughly 12.6Gb in discoveries for 2005, while Campbell claims we have only discovered 4.9Gb?


Campbells number is lower because he does not include deepwater. Pup55 his number is too high due to his method. IHS Energy gives an amount of 7 Gb in discoveries for 2005, of which approximately 2 Gb in deepwater, which Campbell has subtracted in his graph, claiming 4.9 Gb. The same applies for 2004, A total of 7.7 Gb was discovered in 2004 (including condensates) according to IHS Energy, of which approximately 3 Gb in Deepwater, which is omitted from the graph.

[JD: Okay. I'll take your word for it on the IHS figures. Just out of curiosity, why do you think pup55's numbers are too high?]

Monday, February 20, 2006

245. WHERE IS THE UNDISCOVERED OIL?

To shed more light on why peak oiler criticisms of the USGS are faulty, let's look at the details of where the USGS says undiscovered oil exists. The following data comes from Table AR-9 "Discovered and undiscovered petroleum volumes in assessed portions of countries" in the Analysis of Assessment Results section of the USGS study. The value given for each country is mean undiscovered oil in MMBO (million barrels of oil):
Saudi Arabia: 87093
Russia: 77382
Iran: 53114
Greenland: 47148
Brazil: 46746
Iraq: 45099
Nigeria: 37616
Kazakhstan: 21094
Mexico: 20569
Venezuela: 19664
Angola: 14516
Suriname: 13029
Norway: 12881
China: 12115
Libya: 8271
Gabon: 8184
Algeria: 7732
UAE: 7695
Indonesia: 7435
Turkmenistan: 6836
UK: 6329
Azerbaijan: 6306
Falkland Isl.: 5833
Congo: 5800
Colombia: 5120
Australia: 4975
Kuwait: 3840
Qatar: 3617
Oman: 3451
Peru: 3316
Yemen: 3307
Argentina: 3218
Egypt: 3119
Malaysia: 3042
Canada: 2774
India: 2556
Equat. Guinea: 2352
Guyana: 2206
Tunisia: 2180
Brunei: 1802
Cameroon: 1533
Ukraine: 1340
Syria: 1311
Bolivia: 1203
Barbados: 1152
Romania: 1073
Ecuador: 970
Paraguay: 902
Bahrain: 899
Sudan: 771
Trinidad/Tob.: 758
Turkey: 749
Myanmar: 730
Cote de'Ivoire: 603
Eritrea: 559
Cuba: 494
Italy: 371
Chile: 337
Congo(Kinshasa): 326
Netherlands: 319
France: 311
Pakistan: 258
Poland: 206
Ghana: 201
Germany: 156
Uruguay: 147
Hungary: 146
Uzbekistan: 140
Cambodia: 124
Denmark: 95
Thailand: 95
Jnt. Thai/Malay: 91
Namibia: 89
Afghanistan: 88
Croatia: 86
Spain: 78
Benin: 70
Aus/Indo zone: 57
Senegal: 50
Mauritania: 49
Serbia/Monteneg.: 49
Vietnam: 44
Guinea-Bissau: 38
Bangladesh: 37
Malta: 36
South Africa: 35
Togo: 30
Western Sahara: 14
French Guiana: 12
Slovakia: 10
Bulgaria: 9
Czech Rep.: 9
The Gambia: 6
Morocco: 4
Austria: 0
Bosnia: 0
Grenada: 0
Jordan: 0
Moldova: 0
Neutral zone: 0
Slovenia: 0
Now, the peak oilers keep saying that we're not discovering the amounts of oil which the USGS estimated, but the huge fallacy in their reasoning is this: THE LACK OF DISCOVERY IN REGION X MEANS ABSOLUTELY NOTHING IF LITTLE EFFORT IS BEING MADE TO DISCOVER OIL IN REGION X. If indeed the USGS mean estimates are outrageously high, it should be easy for anyone with access to country-by-country discovery figures (like Campbell, or Rembrandt(?)) to identify at least one country meeting the following two conditions:

1) Discovery in the country during 1996-2003 was substantially less than 27% of the USGS mean estimate for that country.
2) Actual efforts were being made to discover oil in that country in the period 1996-2003 (i.e. significant exploratory drilling was actually taking place).

The following are two graphs from a recent presentation by Mike Lynch (click to enlarge). They nicely illustrate the factor which peak oilers are so keen to ignore. Discovery is a function of two factors: 1) the amount of undiscovered oil in the ground, 2) EXPLORATORY EFFORT. Notice the extremely low level of exploratory effort in the Middle East and FSU.


-- by JD

244. USGS EVALUATES ITS OWN TRACK RECORD

In 226. THE SUPPOSEDLY "DISCREDITED" USGS, I quoted peakearl reciting the usual peak oiler soundbites about the USGS World Petroleum Assessment (WPA) 2000. Let's quote him again:
My understanding is the USGS report is based on a statistical procedure, not geology. The procedure would predict vast amounts of oil in many regions, and enough years have passed to see if their procedure had any validity. Predicted levels of discovery have not occurred at all, and I think have invalidated the analysis, which wasn't based on any known oil. Deffayes has commented that we are a full Middle East behind their predictions, and it's getting worse with time, as discoveries continue to shrink in number and size, with no sign of the trend reversing.
I refuted much of this as uninformed baloney in #226.

Today I have more hard data with a bearing on this issue. It turns out that, in August 2005, T. R. Klett, Donald L. Gautier, and Thomas S. Ahlbrandt (two members of the WPA 2000 team, and the Project Chief) authored a paper for the AAPG (American Association of Petroleum Geologists) Bulletin. This paper ("An evaluation of the U.S. Geological Survey World Petroleum Assessment 2000", AAPG Bulletin, v. 89, no. 8 (August 2005), pp. 1033–1042) looks back at the first 8 years of the 30-year period covered by the USGS survey (1995-2025), and calculates how well the USGS WPA 2000 mean estimates compare against actual reserve growth and new discoveries. In other words, it is a scientific study by the USGS itself to see whether the critique by Campbell, Deffeyes and other peak oilers holds water.

This is another one of those "get it while you can" documents. The original pdf is lost behind a subscription firewall, but you can still get an html version (minus the graphics) from the Google cache. It is located here.

Here's the results in a nutshell:
This study compares the additions to conventional crude oil and natural gas reserves as reported from January 1996 to December 2003 with the estimated undiscovered and reserve-growth volumes assessed in the U.S. Geological Survey World Petroleum Assessment 2000, which used data current through 1995. Approximately 28% of the estimated additions to oil reserves by reserve growth and approximately 11% of the estimated undiscovered oil volumes were realized in the 8 yr since the assessment (27% of the time frame for the assessment). Slightly more than half of the estimated additions to gas reserves by reserve growth and approximately 10% of the estimated undiscovered gas volumes were realized.
Breaking this down, it is clear that the USGS estimate has been accurate regarding reserve-growth. Additions to oil reserves through reserve growth are right on schedule (28% added in 27% of the 30-year time frame). Additions to gas reserves through reserve growth are way ahead of schedule; as the study notes "51% of the estimated 30-yr growth of gas reserves had occurred in about 27% of the forecast span."

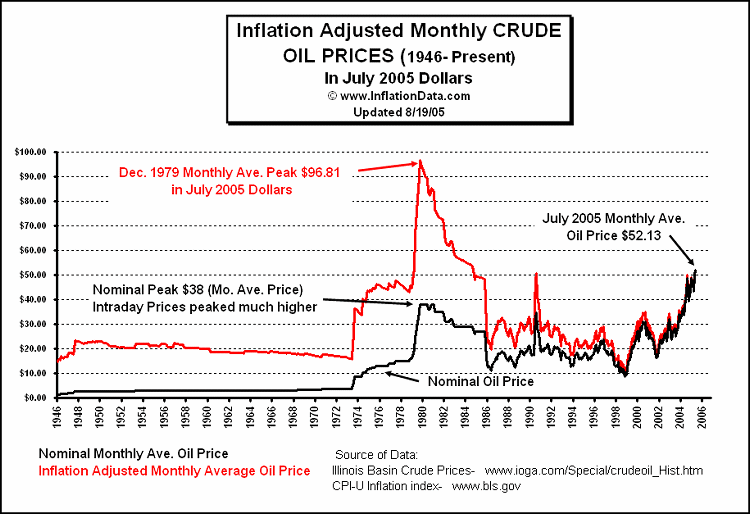
It is true that discoveries of oil from 1996-2003 occurred at a slower pace than one might infer from the USGS estimates. There are a number of good reasons for this, none of which have to do with lack of oil in the ground. The first is the price of oil. The period from 1996-2003 was marked by some of the lowest real oil prices in history, and the nominal price only briefly nudged above $30 at its highest, as you can see in the following chart (click to enlarge).

It's hardly suprising to see flagging discoveries in the middle of an unprecedented oil glut. The authors' describe the situation like this:
The decision of investors in the global market to preferentially invest in development of previously discovered fields instead of exploration for new ones is not explained by the statistics. However, several explanations exist for such a decision. One explanation is that the U.S. Geological Survey estimates are overly optimistic, and that much smaller volumes of oil are actually available for new-field discoveries than were estimated in the U.S. Geological Survey 2000 study. However, this explanation seems unlikely. In contrast to gas, oil may be transported from anywhere in the world where it occurs, therefore representing a complex balance of supply and demand. Until very recently, the price of oil has been relatively low since 1995, the last reported data used in the 2000 U.S. Geological Survey study. At the same time, rates of exploratory drilling have also been at a very low level. Reserves replacement has come about mainly through enhanced development of previously discovered oil fields. The preference for reserve growth in previously discovered fields instead of wildcat exploration is not surprising. Reserve growth represents a very low-cost, minimal-risk strategy. Most of the undiscovered resources reported in the U.S. Geological Survey World Energy study are in environmentally, economically, or politically difficult locations. Some of the oil resources estimated by the U.S. Geological Survey were expected to come from remote localities such as northeast Greenland, but the World Petroleum Assessment 2000 predicted that most of the undiscovered oil could be found in and around the existing major petroleum provinces of the Middle East, North Africa, and the countries of the former Soviet Union. Large parts of these important areas were not available to exploration during the first 8 yr of the forecast span. This is certainly the case in some of the countries of the Middle East and North Africa. Iraq, Iran, and Libya presented limited investment opportunities during the 8-yr period of this study, and investment in oil and gas exploration in Russia, Azerbaijan, and the central Asian republics has been limited also by various constraints on pipeline construction and perceived political and economic instability. In contrast, many previously discovered fields have consistently presented a stable, known opportunity for oil and gas investment. In this context, it is surprising that as much as 11% of the estimated undiscovered oil resource was found, and that 28% of the estimated potential reserve growth was realized in the 8-yr period. This large volume of reserve additions probably reflects the unprecedented global increase in oil demand that has occurred in recent years.
The peak oilers would have a lot better case against the USGS if somebody was actually exploring/investing in places like Iran and Iraq, where the USGS says most of the undiscovered oil is located.
-- by JD

Sunday, February 19, 2006

243. OIL DRUM SWIRLING DOWN THE TOILET OF DOOM

philipmartin has posted a comment which deserves its own article:
This is off-topic..but there's an interesting discussion over at The Oil Drum over conservation versus vacation travel etc.
It seems really to have brought some loonies out of the woodwork and a few surprising admissions from regulars.
I've cut down my travel because I think it's the right thing to do for myself but others, on one hand, are really relishing the peak for various weird reasons, whilst others have the 'I want to see everything before I die' attitude. I have to hand it to you JD I think your analysis of these people, generally, is more right than wrong. I really thought this bunch had a different attitude. They criticize profligate behaviour day after day and then - behold! - it's all been a big joke. Fuck me...
This is the thread philip is referring to, and here's the doomer argument for those of you who are just tuning in: Peak oil is going to cause the collapse of civilization, so you might as well "party on" and waste fuel while you can, OR (alternatively) live as wastefully as possible in order to bring on the collapse sooner. These attitudes are the predictable endpoint of doomerism, as we have previously described in 78. DOOMER TYPE #3: THE PARTYER, 77. DOOMER TYPE #2: THE FULL THROTTLE "SURVIVOR", and 75. DOOMER TYPE #1: THE SOCIAL DARWINIST. It's very sad to see the Oil Drum -- a site with many redeeming qualities -- slowly succumbing to this nihilistic garbage.

We here at POD take a different view. We believe that the task of our generation(s) is to meet the challenge of peak oil, and work relentlessly to ensure a good outcome. Partly, that involves taking personal responsibility and not making up stupid excuses to waste energy.

At the moment, I live in Japan, and have the greatest admiration for Japanese frugality and social responsibility, as I have previously described in 156. BICYCLES IN JAPAN and 144. YOUR BUDDY: THE SPACE HEATER. Check out this amazing material about Japan from a recent Washington Post article:
Japanese Putting All Their Energy Into Saving Fuel

By Anthony Faiola
Washington Post Foreign Service
Thursday, February 16, 2006; Page A01

KAMIITA, Japan -- When the Japanese government issued a national battle cry against soaring global energy prices this winter, no one heeded the call to arms more than this farming town in the misty mountains of western Japan.

To save on energy, local officials shut off the heating system in the town hall, leaving themselves and 100 workers no respite from near-freezing temperatures. On a recent frosty morning, rows of desks were brimming with employees bundled in coats and wool blankets while nursing thermoses of hot tea. To cut back on gasoline use, officials say, most of the town's 13,000 citizens are strictly obeying a nationwide call to turn off car engines while idling, particularly when stopped at traffic lights.

Takao Iwase, Kamiita's husky administrative director, joined other locals in switching off the heat at home, too -- leaving his family to quickly hustle from steaming nighttime baths to the warm comforters on their traditional futons. "We're saving [$100] a day at city hall by shutting off the heat," Iwase, wearing four layers of clothing and a winter coat inside his office, said proudly. "But we no longer see this as just an economic issue. Japan has no natural resources of its own, so saving energy has become our national duty."
This is the kind of cheerful, "can do" commitment our world needs more of, not the spoiled nihilistic swill the Oil Drum is spreading and catering to.
-- by JD

242. EIA LOWERS ITS PEAK FORECAST

Interesting update from Freddy Hutter over at Trendlines:
Feb 18th, 2006 - Today's graph updates the ASPO & EIA Scenarios. While Colin Campbell's change is minor, an increase in the production peak to 86-mbd from 85, EIA has dramatically cutback and extended its projection of a 113-mbd peak in 2025 to 102-mbd in 2030. Neither of the models propose a change in URR. Compare the new EIA outlook with the graph below to appreciate the magnitude of this change. While we have chosen to illustrate EIA's "high price case" once again, its base case scenario has been revised to 118-mbd from 121-mbd.
The graphs are available at the above link.
-- by JD

Saturday, February 18, 2006

241. REMBRANDT ON THE "GROWING GAP" (PART ONE)

[Note from JD: Rembrandt Koppelaar has written some thoughtful responses to my criticisms of Campbell's graph of the "Growing Gap" (see #230, #237 and #238 below for background). I'm going to break his responses into two parts so it does not become too unwieldy. My comments are given in italics, below Rembrandt's response.]

Item 230: the growing gap

1) Which brings us to the real dirty little secret of the peak oil community:

Despite the fact that this graph is a critical centerpiece of the peak oil argument, NOBODY KNOWS OR EVEN CARES WHERE THIS DISCOVERY DATA CAME FROM.


The discovery data published by Campbell comes from the Petroconsultant/IHS Energy database.

Petroconsultants was formed in the 50's by Harry Wasall, a field geologist who used to work for shell. The company initially was a consultancy called Wassal & associates covering Cuba and Latin America. Later it expanded when Wassall moved to Madrid in 1962 into Petroconsultants, covering the global oil industry.

"Petroconsultants maintained first class connections and was one of the first to computerize its database. It secured contracts to manage the major companies' data on a confidential basis. Over the years it expanded its network of contacts around the world, including the former Soviet Union. On Harry Wassal's death, Petroconsultants was acquired by IHS Energy of Denver, Colorado, and full under new management, leading to many changes in its staff and manner of doing business”
Source: C. Campbell, Oil Crisis, 2005 edition – Multi – Science Publishing Co. Ltd ISBN 0906522 39 0

-----

[JD's response: This explanation raises many unanswered questions. First of all, the quote from Campbell is just a paragraph of generic remarks about Petroconsultants, and says nothing about Petroconsultants being the source of the data for the "Growing Gap". We still don't any description by Campbell describing his sources and methodology. Secondly, Petroconsultants was acquired by IHS in 1996, and has not existed as a going concern for 10 years. So how is it that Colin Campbell had access to the Petroconsultants database in 2002 (when he published the first "Growing Gap" graph)? Petroconsultants didn't even exist at that time. And why does he cite "ExxonMobil 2002" as the source of the data, if in fact the source was Petroconsultants/IHS? Now, it is clear that IHS Energy maintains a highly detailed, proprietary database of discoveries in the oil and gas industry. It is called IRIS21. It is designed for corporate clients and is known to be very expensive. So, are we to assume that Colin Campbell, a retiree, is forking over his own money every year for ongoing access to this database?? That's a little hard to believe.

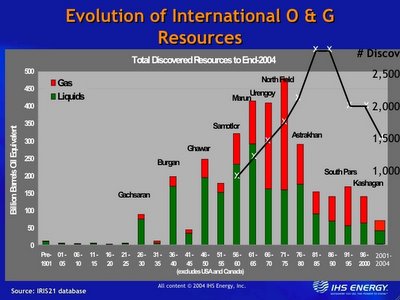
Now, IHS Energy does disclose gross figures from IRIS21 from time to time. For example, here is a screen shot of a presentation from IHS (see slide #4) (click to enlarge):

Did Campbell take his data from this graph? That seems highly unlikely for a number of reasons:

1) The IHS graph is for all liquids not Campbell's "regular conventional oil". So how did he break out the conventional oil from the non-conventional oil? Again: Is he purchasing access to their database?

2) If Campbell is getting his figures from IHS, why don't they match? I have transcribed both the IHS graph and "Growing Gap" graph, and there are a number of huge discrepancies. For example, for the 86-90 period, Campbell gives 83.6Gb of discovery (regular conventional) while IHS gives 67.6Gb of discovery (all liquids). That's a huge 16Gb difference, and it is not at all clear how discoveries of conventional oil can exceed discoveries of conventional + unconventional.

3) I would also point out a discrepancy noted by Antimatter. This is slide #6 of the IHS presentation:

As you can see, this figure is IHS's equivalent to Campbell's "Growing Gap", but there are many significant differences. For example, for 1999 and 2000, Campbell gives discovery of about 15Gb, while IHS gives values well exceeding 20Gb.

The bottom line: Even if Campbell is getting his figures from IHS (which is a highly suspect theory, for the reasons I've enumerated), why should we trust Campbell more than IHS with regard to IHS figures? Clearly IHS has better access to their own database than Campbell.

Thursday, February 16, 2006

240. CLEANING THE PETROLEUM CRACK PIPE

Heading Out at the Oil Drum had an eye-opening post recently about EOR (Enhanced Oil Recovery) using CO2. Here's a tid-bit from the Oil & Gas Journal:
Glencoe Resources Ltd., private Calgary independent, is using the gas to improve recovery of primarily light oil from multiple formations in several depleted oil fields about 100 miles north-northeast of Calgary.

The company hopes to boost the recovery factor to as high as 40% from 10-20%.
Here's Heading Out's comments on another EOR program in China:
This technique is being used in Liaohe, the third largest oilfield, in China, which is now declining in production. By pumping in flue gas from a nearby power plant and combining it with steam the recovery of oil from the reservoir was increased from the 20 -30% achieved with steam, to around 50 - 60%.
From an article on Weyburn, a Canadian EOR project:
Carbon-dioxide injection will allow EnCana to extract another 140 million barrels of oil from its 51-year-old Weyburn field, an enormous volume at a time when the average new well drilled in Western Canada yields a mere 50,000 barrels.

[...]

An oil reservoir that has been drained to the point of being unprofitable is often called a dry well, but that term is misleading. In fact, it's more like a wet sponge: You can wring it once, and get a lot of water. A second squeeze will extract a bit more. Eventually, your efforts are in vain -- even though that sponge is still wet.

Now, better technology and high crude prices are about to shift an enormous amount of oil into the grasp of the industry. As many as five billion barrels could be added, according to Mr. Issacs. That would more than double Canada's conventional oil reserves.

Others have even higher hopes. Richard Baker, president of Epic Consulting Services in Calgary, says eight billion barrels could be added to reserves, a figure that would include the widespread injection of water into existing wells. "It'd be like finding eight giant reservoirs," says Mr. Baker, who is working on a report for the industry that is aiming to nail down the opportunity presented by enhanced recovery. "It's a question of when it's going to occur, not if it's going to occur."Source
I was initially sceptical about the economics of CO2 injection, but this Weyburn project is amazing. According to the stats, the project will produce 130 million barrels of new oil (market value: approx. $7.8 billion). Project cost: $5.3 million, including a 330km purpose-built pipeline from the U.S. to Canada. That's a very lucrative investment.

This is data from another Oil & Gas Journal article, kindly sampled by Heading Out:
The latest technology for enhanced oil recovery by injection of carbon dioxide holds the potential to recover 43 billion bbl of oil "stranded" in six mature US producing regions, says a study conducted for the Department of Energy.

DOE's Office of Fossil Energy calls the volume, estimated in the study by Advanced Resources International, "technically recoverable potential."

It identifies as "state-of-the-art CO2 EOR technologies" horizontal wells, 4D seismic to track injectant flow, automated field monitoring systems, and injecting larger volumes of CO2 than were used in earlier EOR projects.he study says state-of-the-art CO2 injection might recover 5.2 billion bbl of 22 billion bbl of oil unrecoverable by conventional production methods in California. The stranded oil is in 88 large reservoirs amenable to CO2 injection.
Note those figures: 43 billion bbl (=43Gb) of oil from mature producing regions in the US. That's four Prudhoe Bays right there -- almost as much oil as Ghawar has pumped in its entire service life. In the U.S. of all places! 43Gb is twice the current reserves of the U.S. That's enough oil to supply current U.S. oil demand, day in and day out, for 6 years.

This EOR phenomenon is causing a bit of angst and head-scratching amongst the peak oil pessimists. Dave from the Oil Drum says it well. He seems to be wrestling free of his denial and moving towards the acceptance phase:
Was this "technically recoverable potential" booked as reserves to begin with? The question matters because one of the common arguments used against peak oil is that EOR increases the URR. And that appears to be the case in these CO2 injection cases if the oil is indeed "stranded" and was never counted as reserves. If that is indeed so, then this would appear to be a case of reserves growth without new discovery due to the application of technology.
Indeed, it seems technology has helped us "discover" four new Prudhoe Bays in the U.S., and (yup, your guessed it) this will be YET ANOTHER type of "funny oil" which Colin Campbell will not add to his graph of discoveries ("The Growing Gap", see #238, #237 and #230 below). Or, if he does add it, he will be "backdating" it into the past so we can all maintain the polite peak oiler groupthink that we aren't discovering much oil anymore.

At a deeper level, I believe we are going to increasingly see a phenomenon which is familiar to anyone who has watched a marijuana smoker clean an old resin-encrusted pipe for a few more hits. There are incredible volumes of oil still remaining in old holes we discovered a long time ago, and pumped all the easy oil out of. So what are we going to do when we run out of new discoveries? We're going to go back to the old discoveries, and "clean the pipe".

Consider Ghawar. We have this field riddled with thousands and thousands of injecting/extracting perforations, and equipped with massive capital investments. Are we really going to walk away from if after it poops out the first time, or the second time, or even the third time? I doubt it. There will still be a massive volume of oil down there, already discovered, and we know it's there. Why not hit it with CO2, or fracture it with a nuke, or put a nuclear reactor on site to cook it out? Or even mine it, like coal, as was done in the early days of oil? Essentially, we're talking about a shift from a "hunter-gatherer" style of oil extraction, to a more sedentary, capital intensive "agricultural" style of oil extraction, as I've previously discussed.
-- by JD

239. GHAWAR NOW EMPTY

Put on your crash helmet folks. I've come back from another data probe with some shocking information.

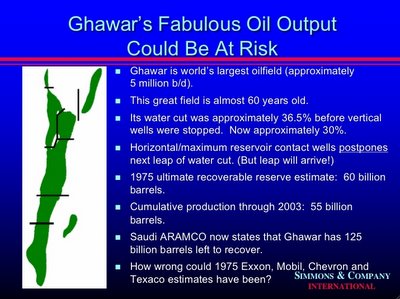
This is one of those Matt Simmons slides we've all grown to love (you can find it here, slide #25):


This is really frightening. It turns out that the powers that be can't put two and two together. Nobody has taken out their calculator and really run the numbers.

Look at the slide. In 2003 Ghawar had a cumulative production of 55Gb (=55 billion barrels). It's production is 5 mbd (million barrels per day). And here's the kicker: the ultimate recoverable reserve (URR) estimate in 1975 was 60Gb.

Do the math. 5 million barrels a day times 365 days a year is 1.8Gb per year. Multiply that by 3 years (2006 minus 2003), and you get 5.4Gb. Add that to the cumulative production (55Gb+5.4Gb) and you get 60.4Gb. The amount of oil that has already been pumped out of Ghawar is greater than Ghawar's URR.

In layman's terms, this means that Ghawar is completely empty. The only substance coming out of it now is water. Production hasn't just gone into a steep nosedive of 5, 10, 15 or 30% -- it has dropped to zero. We have already produced more from Ghawar than can ever be ultimately recovered from Ghawar. It's amazing the truth hasn't leaked out already. There must be the mother of all cover-ups going on.

Man, this is so scary. The lights are flickering here. Is your power still on? Hello? Ohmygod, We're so f*cked....
-- by JD

Tuesday, February 14, 2006

238. MORE FUN WITH "THE GROWING GAP"

As we have seen, Colin Campbell and the peak oilers like to show that we're in big trouble because oil discoveries have peaked and are relentlessly declining, as shown in the frightening graph of the "Growing Gap" which is Exhibit A in peak oil circles:

We have also previously noted that Colin Campbell defines "oil" very narrowly, and does not include oil sands and heavy oil as oil, even though the syncrudes produced from them have the same chemical composition as oil, and are refined, marketed and used just like oil. I've often wondered what the "Growing Gap" would look like if we included the discovery of the Venezuelan and Canadian tar sands. I've done the calculation, and here's what the picture looks like:

The little tiny smudge at the bottom is Campbell's graph of the "Growing Gap", reduced to make the size of the diagram manageable. (The height of that box is 60Gb). The grey line coming up from the middle indicates the discovery of the oil contained in Venezuelan and Canadian tarsands deposits (a total volume of 3,500 Gb). For improved visibility, I made the long grey line about twice as fat as it should be, and arbitrarily set the date of discovery for the tarsands around 1960. Kind of puts a whole new spin on the situation, doesn't it?
-- by JD

237. GLITCH IN CAMPBELL'S DISCOVERY FIGURES

Let's return once again to ASPO's "Growing Gap":

I have enlarged and transcribed this graph into numbers by measuring with a ruler. Note the two years between the red bars (click to enlarge). These correspond to the years 2004 and 2005, and Campbell's figures for discovery in those years are (respectively) 4.1Gb and 4.9Gb.

Now we need an independent check on these numbers, so let's turn to another unsung hero of peak oil: pup55 from peakoil.com. pup55 isn't playing to the cameras, making statements about going back to the stone age etc. He's doing the PO community a much greater service: quietly compiling data.

pup55 follows and compiles the monthly discovery announcements from Alexander's Oil and Gas Connections, as he describes in this thread. As pup55 would be the first to admit, his methodology isn't airtight. It overestimates in some ways, and underestimates in others. The beauty of it, though, is that the data and methodology are open, so anyone can go verify it for themselves. Whatever its defects, this is far superior to the presentation of Colin Campbell -- the man behind the curtain -- who gives no genuine sources for his data, and does not describe his methodology.

The bottom line for our purposes is this: pup55 has counted 9.7Gb in discovery for 2004 and 12.6Gb in discovery for 2005. pup55 has posted the spreadsheets if you want to check them yourself.

Sooo.... What's going on here? Why are Campbell's numbers so low? Where is he getting them from? Why is it the industry has -- verifiably -- announced roughly 12.6Gb in discoveries for 2005, while Campbell claims we have only discovered 4.9Gb?

------

Chris Vernon posted a pertinent comment, which I will address here because it's important. He writes:
Could the fact that these numbers are larger than Campbell's be because Campbell is counting new discovery made today in a field originally discovered in say 1980 as a 1980 discovery and not a 2006 discovery. Booking reserves for the year the field was originally discovered?
This is a reasonable theory, so to test it, I enlarged and screen captured the "Growing Gap" graph from 2005-01, and the "Growing Gap" graph from 2006-02. I then adjusted them to the same size, printed them out, overlayed them and held them up to the light. It turns out that the values for all years from 1930 to 2002 are identical. In the 2005 version, the value for 2003 is 2.8Gb, and all subsequent values are "Future Discovery" (i.e. projections, not historical values). In the 2006 version, the values are 2003=4.9Gb, 2004=4.1Gb and 2005=4.9Gb, and all subsequent values are "Future Discovery".

Now, pup55 has counted 9.7Gb for 2004, and 12.6Gb for 2005, and that gives a total of 13.3Gb more than Colin Campbell for those two years. So where did that 13.3Gb go? It couldn't have gotten backdated to any year between 1930 and 2002 because values for those years have not changed. The only place it could have gone is 2003, but Campell's value for 2003 only increased by 2.1Gb from 2005 to 2006. So the inevitable conclusion seems to be that:

a) Chris's theory is incorrect. Colin Campbell isn't doing any backdating. The past curve stays exactly the same from year to year, AND
b) 11Gb of discovery from 2004 and 2005 -- roughly an entire Prudhoe Bay -- just disappeared. Where did it go?

-----

Also, one more thing. Campbell "cites" ExxonMobil(2002) as his source for past discovery figures. I showed below (in #230) that this is a vaporware citation. As much of a problem as that is, there's yet another problem -- i.e. how is it that Campbell gets figures for 2003, 2004 and 2005 from a source published in 2002? This is very fishy, and would probably merit an F even as a college term paper due to shoddy documentation and evidence.
-- by JD

Monday, February 13, 2006

236. GRAPHOILOGY ON THE USGS

Khebab is a statistical wizard, and one of the unsung heroes of the peak oil community. His excellent new blog GraphOilogy focuses on in-depth mathematical analysis of peak oil issues, and is highly recommended for people who want to know/discuss the quantitative details.

As we saw in #226, Colin Campbell admits to being confused by the statistical methodology of the USGS, and may not be the best person to comment on its validity. Khebab is now working to remedy this problem. Unlike most of the USGS critics, he is digging deeply into the USGS World Petroleum Assessment 2000, and elucidating its true mechanics. I'll refer you to the article at GraphOilogy for details and discussion.
-- by JD

235. MOLECULAR MANUFACTURING AND SUSTAINABILITY

In the past I've written for POD about nanotech solar cells and futurism. Today I'd like to revisit both with a more in-depth look at one application of Nanotechnology which is very relevant to Peak Oil and the wider energy and environmental situation: Molecular Manufacturing.

Molecular Manufacturing basically means building products atom by atom. This could done with countless tiny machines ("assemblers") contained in a larger device called a Nanofactory:


A small nanofactory


With these sorts of machines (described in detail here), virtually any product could be made from simple elements like carbon, hydrogen, oxygen and nitrogen, and recycled into something new with no loss of quality. All products will be atomically precise and completely free of defects. They can be designed on computer and assembled anywhere from a data file.

Obviously this comes with dangers, not least the ability to make weapons. Organizations like the Center for Responsible Nanotechnology (CRN) and the Foresight Institute are considering ways to regulate this, such as with integrated security and an approval system for safe designs. The purpose of this post isn't to speculate about the safety of Molecular Manufacturing, although that's a very important issue. Instead, similarly to Omnitir's space industrialization articles, I would like to point out just a few of the effects Molecular Manufacturing could have on the energy and resources situation in the near- and medium-term future.

Like space industrialization, Molecular Manufacturing sounds "science-fictiony" but it actually isn't. The principles have been laid out very thoroughly in books such as Nanosystems more than ten years ago, and scientists are steadily working towards realizing the concept. It is almost certainly possible to build a Nanofactory within 30 years, and CRN is concerned that a $10 billion project started today could develop one in less than a decade (the RepRap project is working on macro-scale self-assembling machines already). Once Nanofactories are sufficiently advanced to manufacture more Nanofactories, they could become commonplace within a matter of months.

Almost anything that is possible with today's material science will be much cheaper and of much better quality using Molecular Manufacturing. The most obvious effect of this for the energy situation is a dramatic cost breakthrough in renewable energy. In New Solar Cells I talked about solar panels based on current nanotechnology can be rolled, folded or painted onto surfaces. Using a Nanofactory, you could manufacture these, or any other kind of renewable energy device, at home for virtually no cost. Efficiency could be improved several fold. Solar panels could be integrated into every surface. Energy storage systems, from flywheels to hydrogen, will be vastly improved, allowing renewable energy to decisively trump fossil fuels (see Powering Civilization Sustainably).

Molecular Manufacturing will also deliver big improvements in efficiency. Ultra-lightweight carbon fibre materials could be made more cheaply than today's steel frames, giving a big efficiency boost to vehicles of all kinds. Atomically precise surfaces would have ultra-low friction, like these nanotube bearings.

We will probably also see a cost breakthrough in the affordability of accessing and operating in space. While space industrialization is already possible with today's materials, the vastly stronger and cheaper materials allowed by Molecular Manufacturing will make it much easier. Further down the line we could develop self-repairing spacecraft and, along with biotechnology, the ability to synthesize food during long-distance trips, and on Earth. With diamond-strength carbon nanotubes we could even build a space elevator. These things may sound silly today, but the technology that can bring them to life is just round the corner.


A space elevator?


Hopefully I have convinced you that Molecular Manufacturing could be a major factor in our energy and resources future. The ability to make anything out of endlessly recyclable base materials would allow the whole world to enjoy a high standard of living in a completely sustainable way, requiring a major readjustment of Club of Rome-type scenarios. Despite this (or perhaps because of it) environmental organizations have largely ignored advanced nanotechnology. I would love to see them recognize it as the major part of our future that it is, and address both its risks and potential benefits. Molecular Manufacturing is not an "alternative" to a sustainable future. It's one of the technologies that can help us get there.


More:
Powering Civilization Sustainably
Green Nanotechnology
Amory Lovins on Nanotechnology
Unbounding the Future
Non-linear thinking

P.S.
Some critics such as Richard Smalley believe that that Molecular Manufacturing is not possible because of the volatility of chemicals at such a small level, and also because of the so-called "sticky fingers" problem of manipulating tiny things. Of course, nature perfected molecular assembly long ago in living cells, and many scientists believe that the problems can be overcome. But if you have any technical objections to Molecular Manufacturing feel free to share them in the comments.
-- by Roland

Saturday, February 11, 2006

234. AEROTRAIN

The Aerotrain is an interesting transportation idea currently being prototyped by Yasuaki Kohama and his group at Tohoku University in Japan.


Aerotrain Concept


Second Generation Prototype


The basic idea of the Aerotrain is to create a "levitating" train by using the aerodynamic principle of ground lift -- a phenomenon which boosts the lift of a wing when flying close to the ground. This makes it possible to achieve many of the advantages of a maglev train, without the expensive coils. A practical system could fly at speeds of 500km/h, while consuming about 1/2 to 1/3 the energy of the bullet train. The current goal of Professor Kohama's group is to complete a 350 passenger craft with a speed of 500km/h by 2020.

There is also a Quicktime video of the prototype here.
-- by JD

Friday, February 10, 2006

233. THE REAL USGS PREDICTION

The USGS position on undiscovered world conventional oil resources (excluding the U.S.) is completely summarized in this graph (click to enlarge):


Now, there seems to be some confusion in the peak oil community regarding basic probability theory, so I'm going to walk you step-by-step through the meaning of this graph.

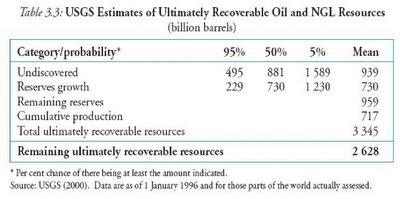
First of all, the USGS does not regard the amount of undiscovered oil in the ground as a fixed number. It is often claimed, as Rembrandt writes in #232 below, that "the USGS predicts a total of 939 Gb of undiscovered conventional oil and NGL in the world". This is not true at all. 939 is their "mean" prediction.

Basically, the USGS regards the amount of undiscovered oil like tossing a die.

It's a random process which can turn out different ways. So if you ask them: "How much oil is in the ground?" they don't say definitively: "The die will show a 3." They say: "The die can turn out to be 1, 2, 3, 4, 5 or 6, and we're going to tell you how probable each of those outcomes is."

Now, if you roll a die, the mean outcome turns out to be "3.5". So that is basically what the USGS is saying for the "die" of oil production. The die will be rolled one time, and the USGS gives a mean of "3.5". Does this imply that the USGS is wrong if the die shows a 1, or a 6, or a 4? Not really, because they recognized the possibility of all those outcomes.

Looking to the graph, notice that the horizontal axis indicates the different outcomes. The worst case outcome is about 200 Gb, and the best case outcome is about 1,300 Gb. The green lines running up from each amount indicate the probability of that outcome. As you can see, the probability is almost zero at the extremes. It is possible that there is 200Gb or 1,300Gb -- it's just highly improbable.

The question is: What is the most likely outcome? Well, there are various ways to look it. One way is to look at the most frequent outcome -- i.e. the green stripe which is the tallest. This is the "mode", and here it corresponds to a value of about 500 Gb.

Another way is to look at the "average" outcome -- i.e. the mean. In this case the mean turns out to be 649 Gb. Notice also that this curve (which is called the "log-normal density") is different than the usual Gaussian bell curve. It's assymetric and squashed to the left side so that the mode is lower than the mean.

This has interesting consequences. Notice the F95, F50 and F5 numbers given at the upper right of the graph. These numbers have the following meaning:

F5=1,107: The probability of undiscovered oil exceeding 1,107 Gb is 5%.
F50=607: The probability of undiscovered oil exceeding 607 Gb is 50%.
F95=334: The probability of undiscovered oil exceeding 334 Gb is 95%.

The F50 value is the "median" outcome. If you ran history over and over again (like rolling a die), half of the outcomes would exceed 607, and half of them would not.

If you think about it, finding 607 Gb is basically a matter of flipping a coin, so would you actually bet on a good outcome happening? Would you bet your life on it happening? That would be equivalent to putting a loaded gun and an unloaded gun into a bag, pulling one out at random, putting it to your temple, and pulling the trigger. How confident would you be of a good outcome in that case? That's basically the same amount of confidence you should have toward the outcome of finding at least 607 Gb.

Even stranger, notice that the mean (649 Gb) is greater than the median (607 Gb). This means that finding 649 Gb (or more) is even less probable than finding 607 Gb (or more). The oil discovered will exceed the mean of 649 Gb in less than 50% of the outcomes if we run history over. The odds of achieving at least the mean are even worse than the odds of not killing yourself with the guns in the bag game. It's like playing the bag game with the added rule that you are slightly more likely to choose the loaded gun. I don't think anyone would be eager to play that game, so I don't think we should have too much confidence in reaching the mean of 649Gb.

I'm a conservative bettor, so I personally would rather put my money on an outcome which is at least 75% probable. Just eyeballing the graph, that would appear to be a value of at least 400 to 500 Gb of world undiscovered conventional oil resources (excluding U.S.). From that number we would also have to subtract discoveries from 1996-2005 (i.e. for the period after completion of the USGS study).
-- by JD

Thursday, February 09, 2006

232. INTERPRETING THE USGS STUDY

[Note from JD: Rembrandt Koppelaar is author of the World Oil Production & Peaking Outlook, the first bottom-up study of future oil production with an open methodology/ sources and no expensive price tag. He has kindly offered to contribute to POD from time to time. This is his first article.]

The problem with the world petroleum assessment of the USGS is not the study itself. As JD has noted "The USGS explicitly says that it is not making a forecast". The problem lies with the interpretation made by various institutes, of which the most problematic is the one by the International Energy Agency. They use the numbers of the USGS as the ultimate guideline to predicting a peak beyond 2030. Interestingly enough the IEA stopped copying the numbers directly in their World Energy Outlook 2005 as opposed to the WEO 2004:

World Energy Outlook 2004:

World Energy Outlook 2005:

The main change is that instead of using data as of 1 January 1996 from the World Petroleum Assessment 2000 by the USGS, they are probably citing up-to date numbers per December 2004. The numbers from the World Energy Outlook 2004 caused various institutes (which I will not call by name) in Holland to believe that we had only used 717 billion barrels up till end 2004, while this number was dated until end 1996. Who reads small letters below tables anyway? And there is even one governmental example who interpreted remaining ultimately recoverable resources as proven reserves. Talking about a misinterpretation…

Anyway what can we learn from the difference between 2004 and 2005 in respect to the USGS study? The total ultimately recoverable resources stayed the same, 3,345 billion barrels, while 331 billion barrels have been produced between 1996 and 2005. It's hard to tell what their real view is since these tables are not explained in detail. For instance in the WEO 2004 they are noting 939 billion barrels of undiscovered per January 1996 quoting the mean value from the USGS study. In the WEO 2005 they are noting 883 billion barrels of undiscovered, mainly outside of MENA (Middle-east North Africa), based upon the USGS study but no starting date is given. What amount of oil has been discovered according to the IEA in the period between 1996 and 2005? We cannot subtract 939 from 883 billion barrels since more oil was discovered in this period.

The biggest shift is observable in reserve growth, going from 730 billion barrels to 308 billion barrels while remaining reserves have increased. According to the "IEA/USGS mix", it's hard to tell what their real view is since these tables are not explained in detail. We could interpret the shift as a large amount of oil went from the reserve growth category to the remaining reserves category and the cumulative production category. But since no underlying method is given, this is quite speculative. It could also be that reserve growth was reassessed (below the table it says IEA analysis based on USGS).

The amount of reserve growth between 1995 and 2003 according to IHS energy amounted to a maximum of 190 billion barrels. If we take this rough number and subtract it from 730 billion barrels we get a number of 540 billion barrels of reserve growth remaining in 2005. This would mean a downgrade of reserve growth by the IEA of 232 billion barrels. That is a massive difference in figures from the IEA within one year, which I find disturbing. But since these tables are very vague, and nobody is pressing on answers from the IEA, we will not know what is behind them.
-- by Rembrandt Koppelaar

Tuesday, February 07, 2006

231. PEOPLE ARE STUPID

It's funny. On the surface, peak oil seems to be all about hard physical facts, graphs and numbers. You know, sciency stuff like this:

That's the image the peak oilers try to cultivate. We're the guys in white lab coats, with calculators. But in arguing with peak oil doomers, I've increasingly come to the conclusion that, at bottom, their argument is simply: people are stupid. Which is not really scientific at all. It's not about the rational reasons why peak oil will be a disaster; it's about the irrational reasons why peak oil will be a disaster.

I wish they would be more upfront about it. Savinar should skip all the false pandering to science, and just lead in with:

"Screw all the stupid data. People are inherently, pathetically stupid. That's the main reason why peak oil is going to be a disaster."

Maybe he could emphasize the basic argument better with some images like these:

-- by JD